Initiating Coverage | NBFC
July 07, 2017
L&T Finance Holdings Ltd
BUY
CMP
`149
Prudent downsizing for attractive business revival
Target Price
`179
L&T Finance Holdings Ltd (LTFH), promoted by L&T Ltd (64.2%) is a leading
Investment Period
12 Months
NBFC with a diversified lending portfolio. Over the last one year the
management has restructured its business model and is focusing on selective
segments where it has competitive advantage, simultaneously downsizing
Sector
NBFC
some products which were making losses.
Market Cap (` cr)
27,181
Range of offerings across diversified book: LTFH’s lending operations are
Beta
1.8
focused on three primary segments viz. Rural 15% (Micro Finance, 2Wheeler
52 Week High / Low
151/74
& Tractors), Housing 19% (Home Loans, LAP & Builder loans) and Wholesale
Avg. Daily Volume
37,68,991
finance 62% (Renewable Energy, Operating Roads, etc.) of loan book. While
Face Value (`)
10
the above segments will be the growth drivers, the management has started
downsizing unattractive range of products.
BSE Sensex
31,369
Loan growth to remain fairly strong: We expect MFI, 2W and Tractor loans to
Nifty
9,675
report 25%/20%/10% CAGR over FY2017-20E respectively. LTFH has been
Reuters Code
LTFH.NS
gaining market share in the Tractor segment (9.5% in 2HFY2017 v/s. 4.5%
Bloomberg Code
LTFH.IN
in 1HFY2017) and expects to achieve double digit over next one year. The
home loan segment is expected to grow at 30% CAGR, while wholesale loan
book by 11% over the same period. The management intends to undertake
Shareholding Pattern (%)
sale down of assets post origination, which will release capital in addition to
Promoters
64.2
strong fee income.
Credit cost should moderate going ahead: LTFH has provided `1,150cr on
MF / Banks / Indian Fls
8.3
its impaired assets and additional `650cr is to be provided. However, there
FII / NRIs / OCBs
16.6
is goodwill on consolidation of its subsidiaries, hence the company will claim
Indian Public / Others
10.9
tax benefit on amortization of the same, which will be used for making
additional provisions, thus, overall credit cost will remain moderate.
Exiting of loss making business to revive ROE: LTFH has restructured some
Abs.(%)
3m 1yr 3yr
business segments and has been downsizing range of products which were
Sensex
4.2
16.2
15.0
loss making. However, as management intends to completely exit the
defocused products, its impact is unlikely to be there from FY19 onwards,
L&T Fin
20.2
63.7
93.5
this together with favorable change in loan book and resultant NIM should
propel the ROE to 17.9% by FY20 from 13.8% in FY17.
Ability to generate strong fee income will support earnings: LTFH has been a
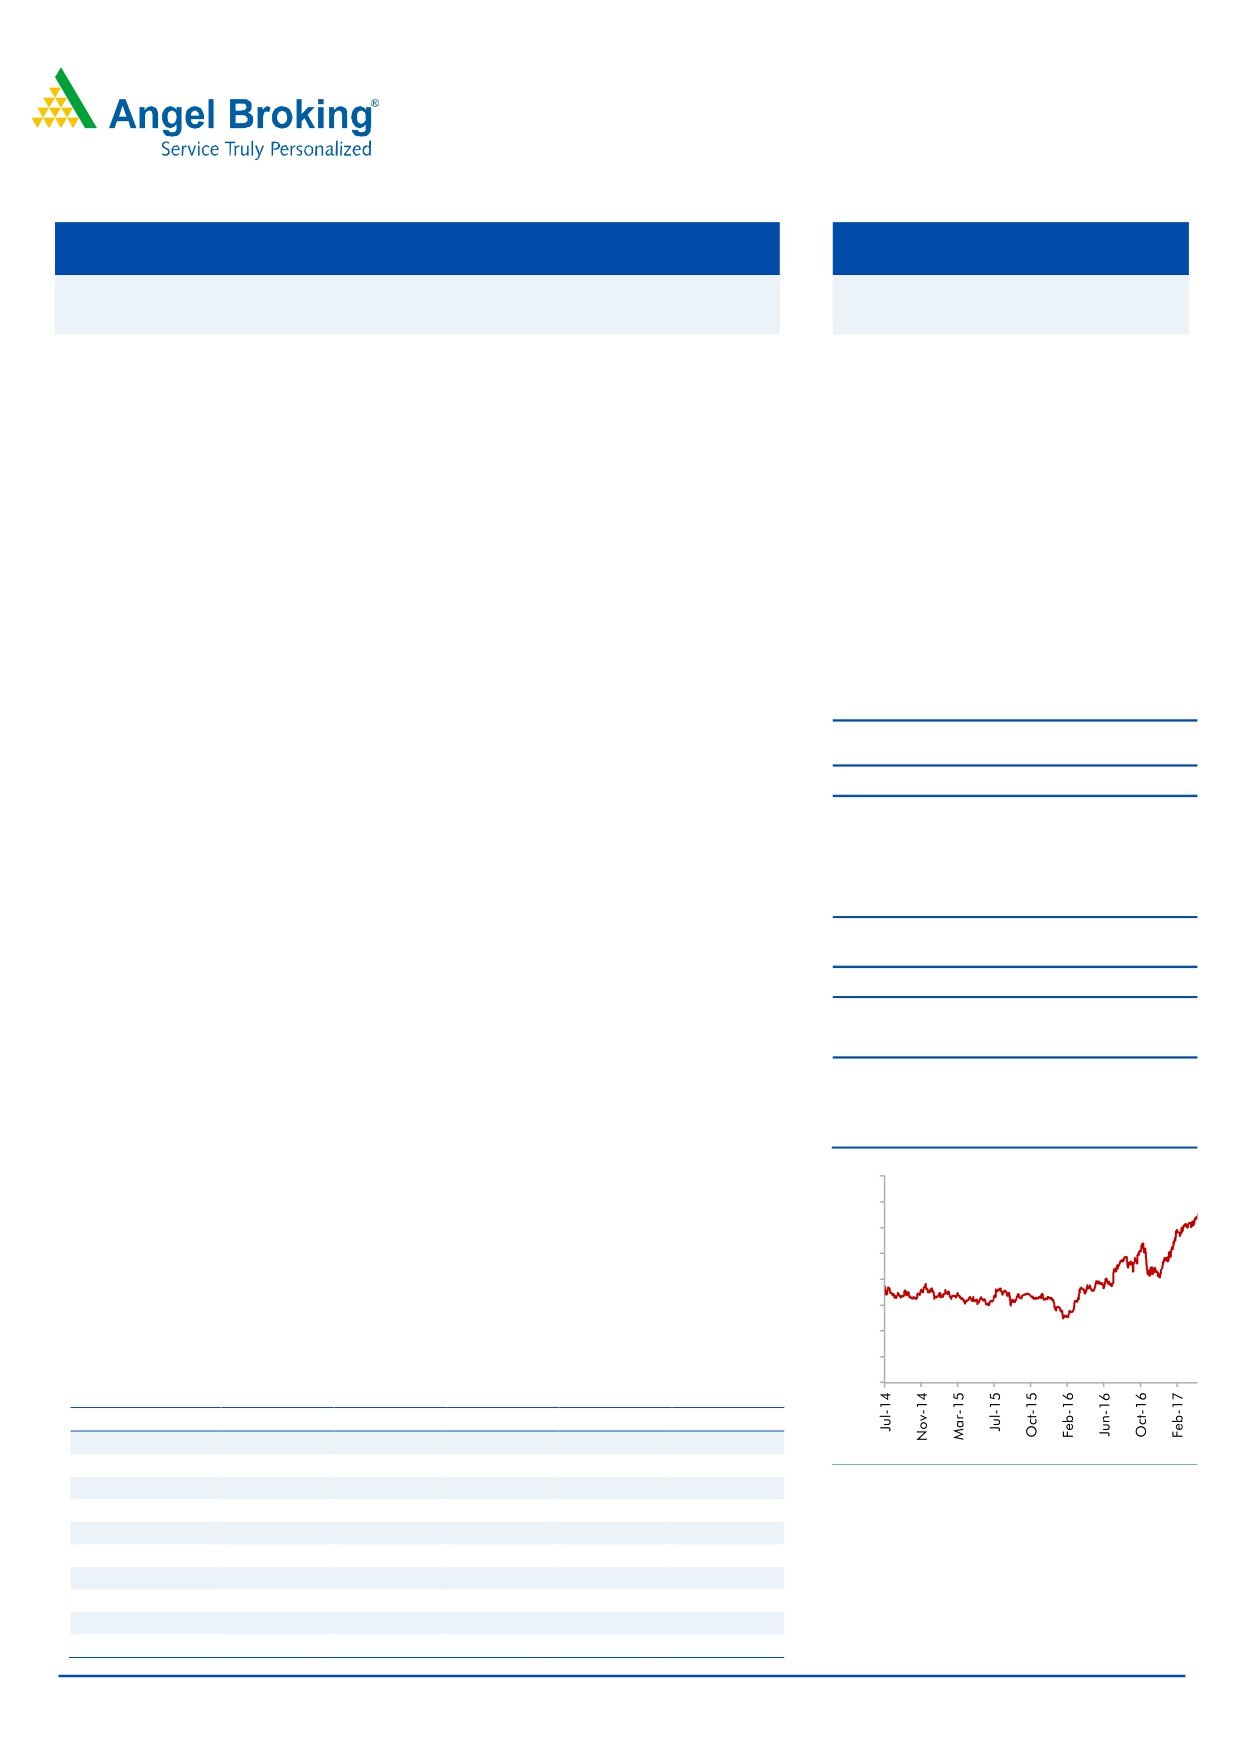
3-year price chart
leader in lending to renewable energy sector and it intends to capitalize on
its expertise of loan origination and subsequently selling it to other financial
160
institutions for fee income. We expect fee income to grow by 30% CAGR over
140
FY2017-20 and this should support a 24% PAT CAGR over the same period.
120
Outlook & Valuation: As LTFH operates in multiple segments, we have
100
valued it based on SOTP. We have valued the rural finance segment at 2.5x,
80
while the housing finance and wholesale finance has been valued at 3x and
60
2x its FY2020E BV each. LTFH’s AMC arm, L&T MF has been valued at 5% of
40
average AUM. Accordingly, we have arrived at a fair value of `179 based
20
on SOTP, and hence recommend BUY on the stock.
0
Key financials (Consolidated)
Y/E March (` cr)
FY2016
FY2017
FY2018E
FY2019E
FY2020E
NII
3,165
3,714
4,006
4,552
5,181
% chg
20.4
17.3
7.9
13.6
13.8
Source: Company, Angel Research
Net profit
854
1,043
1,210
1,520
2,006
% chg
20.8
22.1
16.1
25.6
32.0
NIM (%)
6.0
6.1
5.6
5.5
5.4
EPS (`)
4.9
5.9
6.9
8.7
11.4
P/E (x)
30.4
24.9
21.5
17.1
12.9
Siddharth Purohit
P/BV (x)
3.6
3.3
2.8
2.5
2.2
022 - 3935 7800 Ext: 6872
RoA (%)
1.6
1.7
1.7
1.9
2.1
RoE (%)
11.9
13.8
14.1
15.5
17.9
Source: Company, Angel Research; Note: CMP as of July 06, 2017
Please refer to important disclosures at the end of this report
1
L&T Finance Holdings | Initiating Coverage
Company Background:
L&T Finance Holdings Ltd, promoted by L&T Ltd (holds 64.2%) is a leading
NBFC with a diversified lending portfolio. The NBFC had built a line of
multiple product portfolios, however some of the segments where it didn’t have
significant presence, and was facing severe competition started making losses,
and hence, the management decided to restructure its business model by
downsizing the low profit/ loss making segments. Going ahead, the
management intends to focus only on three segments i.e. Rural Finance,
Housing Finance and Wholesale Finance. The defocused loan book as % of
total loan book has already been brought down to 4% from 8.5%, and we
expect that by FY2018 it will be insignificant compared to the total loan book.
Exhibit 1: Transition towards a more focussed organisation
BEFORE STRATEGY - LTFH 1.0
AFTER STRATEGY - LTFH 2.0
Aspirations of Bank
Aspirations of becoming top quartile NBFC
No RoE focus
Sole objective is RoE focus -18%
Doing 21 products
Doing 7 products in a focused manner
Doing business through 7 lending entities
Doing business through 4 lending entities and shrinking further
Focused on increasing fees along with disbursements
Focused on growing book
Down selling book
Falling short of provisions
Focused on insulating Balance sheet through proactive provisioning
Cost to Income highest at 33%
Cost to Income reduced to 26%
Source: Company, Angel Research
Key Management Personnel:
Mr Dinanath Dubhashi - Managing Director & CEO. He has over 26 years of
experience in the BFSI space involving Corporate Banking, Cash Management,
Credit Ratings, Retail Lending and Rural Finance. He has been associated with
reputed organizations like BNP Paribas, SBI Caps and CARE.
Mr Kailash Kulkani - Chief Executive, Investment Management. He has over 26
years of experience having worked for organizations like Kotak Mahindra AMC,
Met Life and ICICI.
Mr Sunil Prabhune - Chief Executive, Rural and Consumer Lending. He has over 8
years of experience, having worked with ICICI Bank, GE and ICI.
Mr Virender Pankaj - Chief Executive, Wholesale. He has over 25 years of
experience in the banking space and has worked with SBI.
Mr Srikant J - Chief Executive. He has over 20 years of experience and has worked
with BNP Paribas and Commerz Bank AG.
July 07, 2017
2
L&T Finance Holdings | Initiating Coverage
Transition towards a more balanced portfolio of products
and reducing exposure in loss making segments: LTFH had
aspired to become a bank and accordingly had expanded to as high as 21
products. In some of the segments it was a marginal player, while the cost
associated with those businesses was very high, and hence, those segments were
losing money. However, as a change of strategy the organization has been
focusing only on selective 7 products and the key parameters for getting into any
business will be the ability to generate strong RoE.
Exhibit 2: Loan Book Composition FY2017 ( % )
4.0
15.1
18.8
62.1
Rural
Housing Wholesale Defocussed
Source: Company, Angel Research
Exhibit 3: Loan Book Composition ( ` Cr )
Segmental Loan Book
FY16
FY17
FY18E
FY19E
FY20E
Rural
8,644
10,041
12,051
14,226
17,077
Housing
9,811
12,534
15,667
19,584
24,480
Wholesale
34,870
41,403
47,200
51,920
57,112
Defocused
4,931
2,671
1,335
668
334
Total
58,256
66,648
76,253
86,398
99,002
Segmental Contribution
Rural
14.8
15.1
15.8
16.5
17.2
Housing
16.8
18.8
20.5
22.7
24.7
Wholesale
59.9
62.1
61.9
60.1
57.7
Defocused
8.5
4.0
1.8
0.8
0.3
Total
100
100
100
100
100
Source: Company, Angel Research
July 07, 2017
3
L&T Finance Holdings | Initiating Coverage
Investment Rationale
Knowledge of rural hinterland coupled with strong OEM
and dealer relationship a key strength of LTFH
The rural finance of LTFH is largely focused on three segments viz. Microfinance
(MFI), Two Wheeler (2W) & Tractors. Over the years LTFH has developed strong
understanding of the rural hinterland, which helps in growing its MFI business.
Further, it has developed excellent relationship with all major OEMs and dealers,
which has been the key differentiator in market share gain in the 2W and Tractor
financing segments. It has also strengthened the collection systems over the years,
which is critical as far as long term sustainability of this business is concerned.
Exhibit 4: Rural loan growth product wise
` Cr
FY16
FY17
FY18E FY19E FY20E
Micro Finance
2,234
3,551
4,439
5,548
6,936
% Change YoY
-
59
25
25
25
2W Finance
1,761
2,110
2,532
3,089
3,800
% Change YoY
-
20
20
22
23
Farm Equipment
4,649
4,379
5,080
5,588
6,342
% Change YoY
-
(6)
16
10
14
Total
8,644
10,041
12,051
14,226
17,077
Source: Company, Angel Research
Microfinance will continue to be a growth driver in rural segment: Microfinance
business has been a growth driver for LTFH growing by 59% in FY2017. While
there has been some moderation in the last two quarters, we expect MFI book to
grow at 25% CAGR over FY2017-20 and account for 41% of the total rural loan
book. The company has been quick in adapting to technology for the segment,
and has now migrated to 100% cashless and ‘Adhar’ based disbursements.
Two Wheelers segment leaves scope for further market share gain: LTFH has
adopted technology and algorithm based database, which has resulted in sharp
improvement in turnaround time. Ability to take credit call within 10 minutes vis-à-
vis few hours has enabled it to grow this book and gain market share. We expect
the 2W loans to grow by 20% CAGR over FY2017-20 and account for 23% of the
total 2W loan book by FY2020.
Emerging as market leader in the tractor segment: The tractor segment depends a
lot on factors like income levels in rural economy, monsoon and also on various
program of Government addressing the rural masses. Despite lot of moving
factors, LTFH has gained strong market share in tractor financing backed by
increasing presence and relationship with dealers of top OEMs. The market share
has doubled to 9.5% in 2HFY2017 v/s. 4.5% in 1HFY2017, and the management
is confident of having double digit market share in next few quarters.
July 07, 2017
4
L&T Finance Holdings | Initiating Coverage
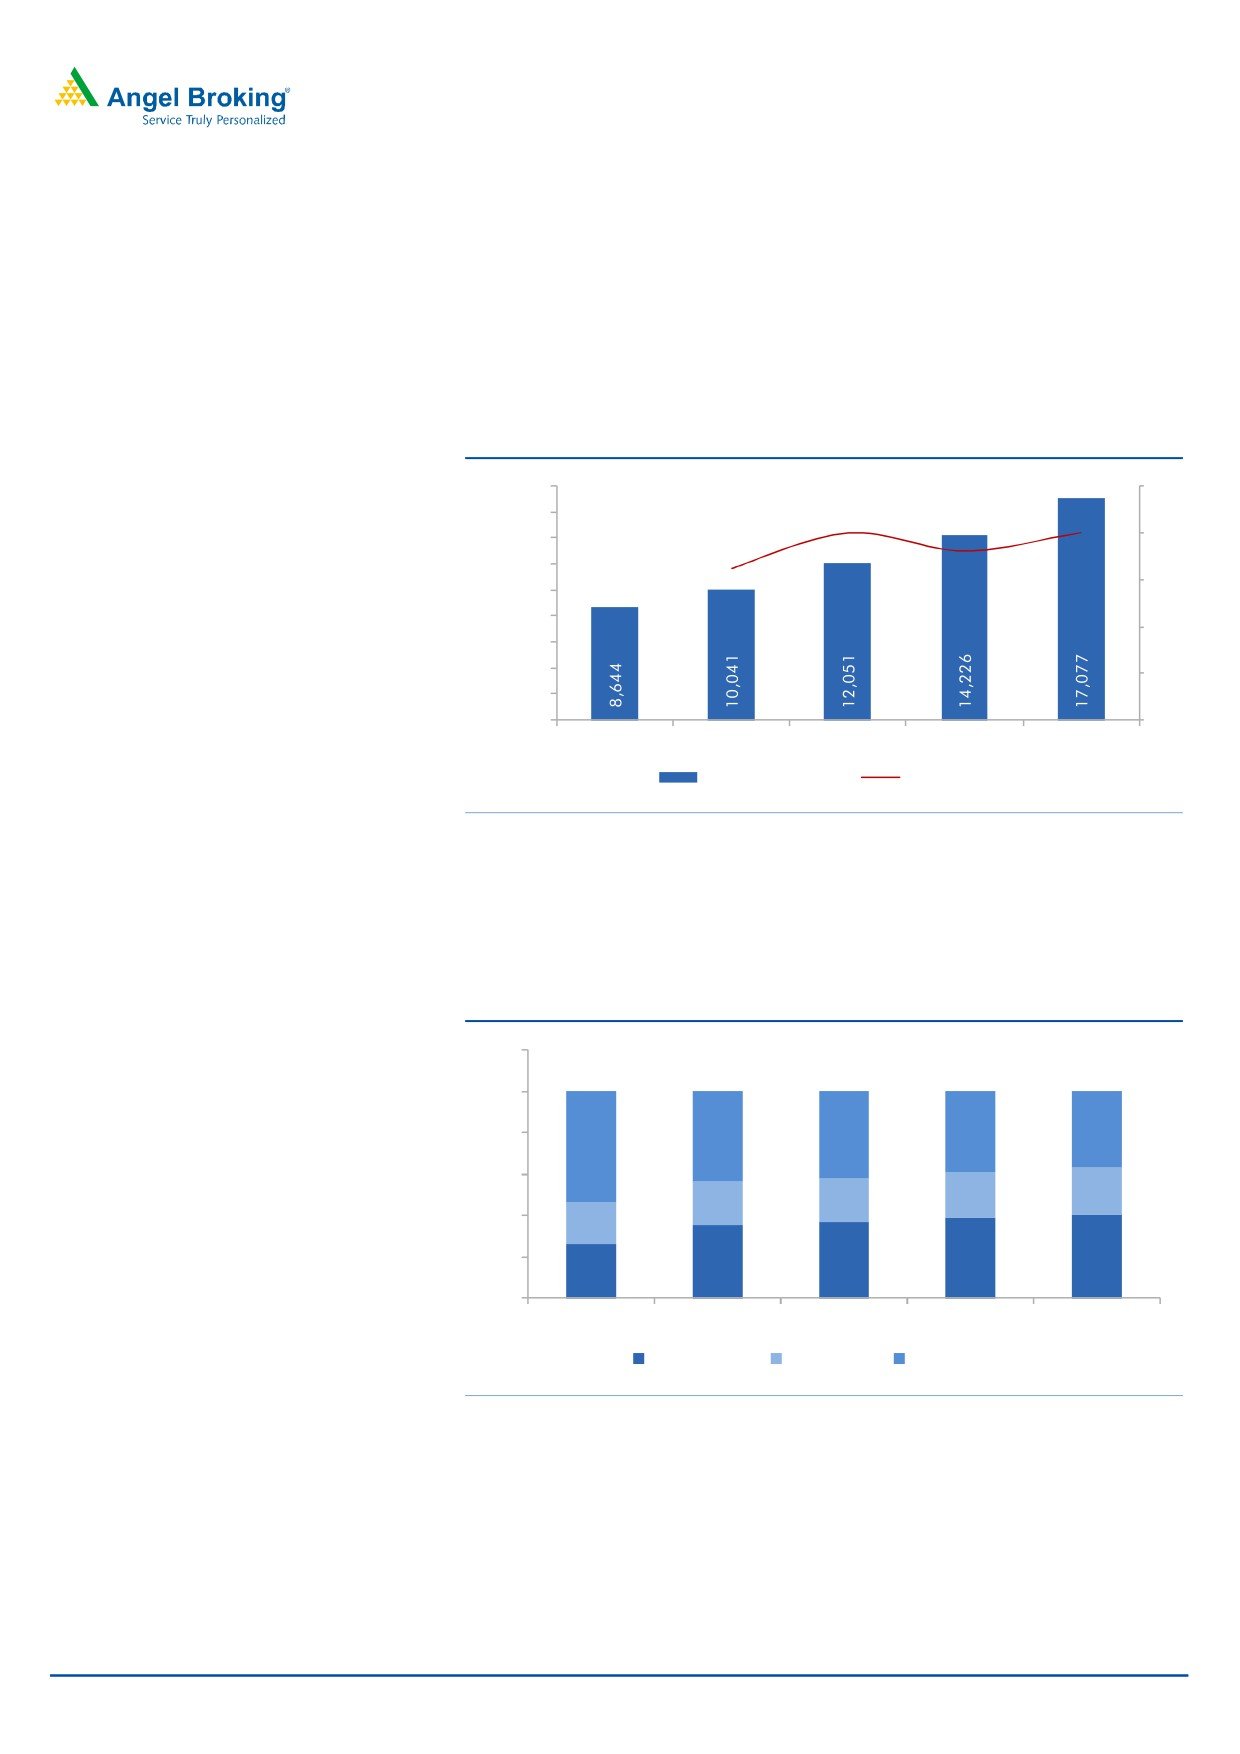
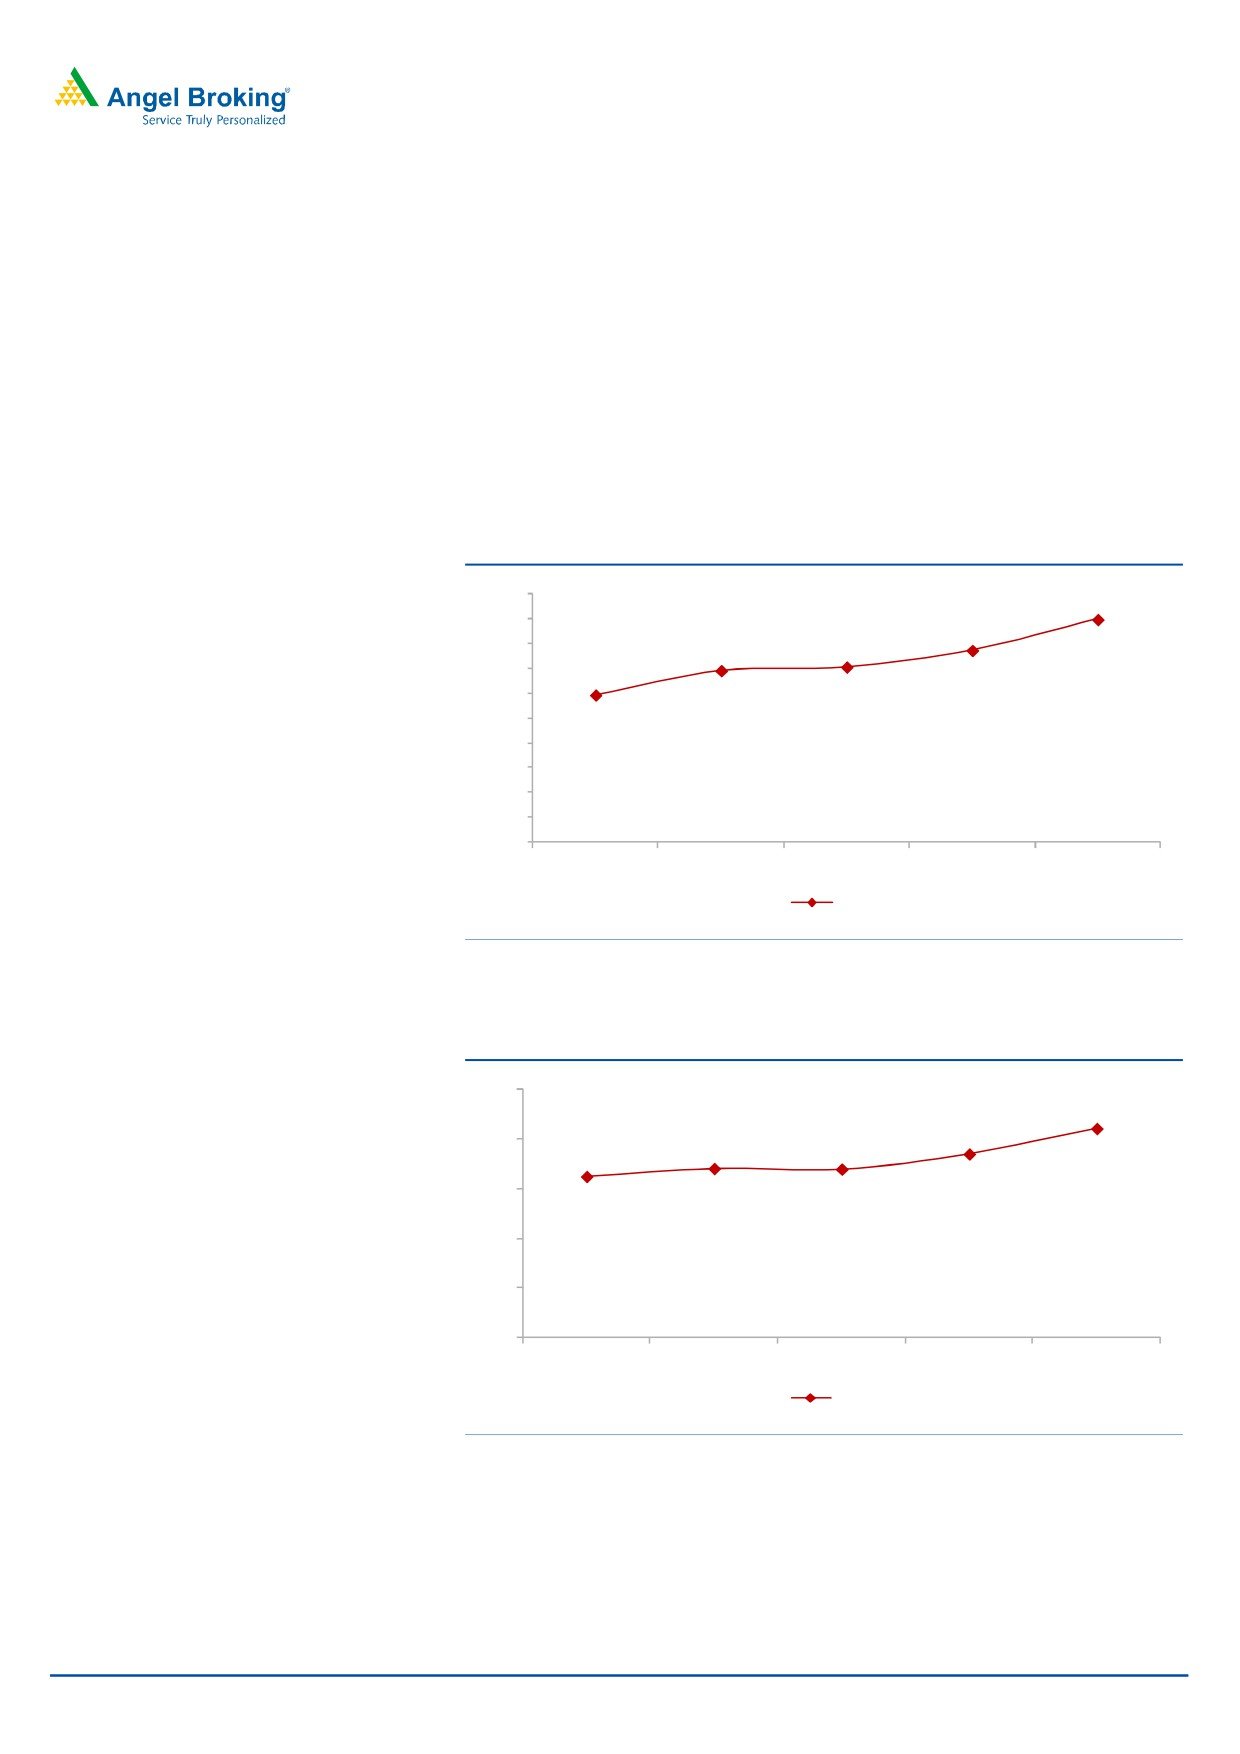
Rural Finance will continue to be a growth driver
Rural segment will continue to be a key area of focus for LTFH. In FY2017 the
company reported 16.2% growth in the rural book. However, the steps taken with
regards to adaptation of technology, faster turnaround time and higher presence
across dealer network could help in growth rate accelerating in the years to come.
We expect 19% CAGR in loan book over FY2017-20.
Exhibit 5: Loan Book growth Rural Business (` Cr)
18,000
25
16,000
20.0
20.0
18.0
20
14,000
16.2
12,000
15
10,000
8,000
10
6,000
4,000
5
2,000
-
0
FY16
FY17
FY18E
FY19E
FY20E
Rural Finance Rs Cr
% Growth YoY
Source: Company, Angel Research
The nature of rural business is of higher credit costs, and hence we have factored
in 450 bps credit cost, similar to FY2017. However, the higher yield should take
care of the credit cost, and despite this the higher operating leverage will ensure
~21% ROE in this business.
Exhibit 6: Rural Loans Composition (%)
120
100
80
39
37
44
42
54
60
22
22
21
21
40
20
20
35
37
39
41
26
0
FY16
FY17
FY18E
FY19E
FY20E
Micro Finance
2W Finance
Farm Equipment
Source: Company, Angel Research
July 07, 2017
5
L&T Finance Holdings | Initiating Coverage
Exhibit 7: Income Statement Rural Business
` Cr
FY16
FY17
FY18E
FY19E
FY20E
Interest Income
1,589
1,823
2,164
2,521
2,964
Interest Cost
611
682
839
946
1,100
Net Interest Income
979
1,141
1,324
1,575
1,864
Fee Income & Other income
70
86
99
114
131
Total Income
1,049
1,227
1,423
1,689
1,995
Total Operating Expenses
390
359
370
400
440
PPP
658
867
1,053
1,289
1,555
Provisions, contingencies & w/off
336
425
497
591
704
PBT
323
443
556
698
851
Tax
112
154
189
237
289
PAT
211
289
367
461
562
Source: Company, Angel Research
Exhibit 8: Balance Sheet
` Cr
FY16
FY17
FY18E
FY19E
FY20E
Closing Gross Loans & Advances
8,644
10,041
12,051
14,226
17,077
Total Assets
9,152
10,412
12,476
14,726
17,727
Closing Net worth
1,193
1,331
1,698
2,158
2,720
Closing Borrowing
7,329
8,686
10,162
11,890
13,911
Other Liabilities
630
396
616
678
1,096
Total Liabilities
9,152
10,412
12,476
14,726
17,727
Source: Company, Angel Research
Exhibit 9: Key Ratios Rural Business
Key Assumptions
FY16
FY17
FY18E
FY19E
FY20E
Growth (% )
Loans
-
16.2
20.0
18.0
20.0
Borrowings
-
18.5
17.0
17.0
17.0
NII
-
16.5
16.1
18.9
18.4
Provisions
-
26.5
17.0
18.9
19.1
PAT
-
37.0
27.2
25.4
22.0
Key Ratios (%)
Yield on advances
20.3
19.8
19.6
19.2
18.9
Cost of funds
9.2
8.6
8.3
8.0
7.9
NIM%
12.5
12.4
12.0
12.0
11.9
Credit Cost
4.3
4.6
4.5
4.5
4.5
ROA
2.4
2.9
3.0
3.2
3.3
ROE
17.7
21.7
21.6
21.3
20.7
Source: Company, Angel Research
July 07, 2017
6
L&T Finance Holdings | Initiating Coverage
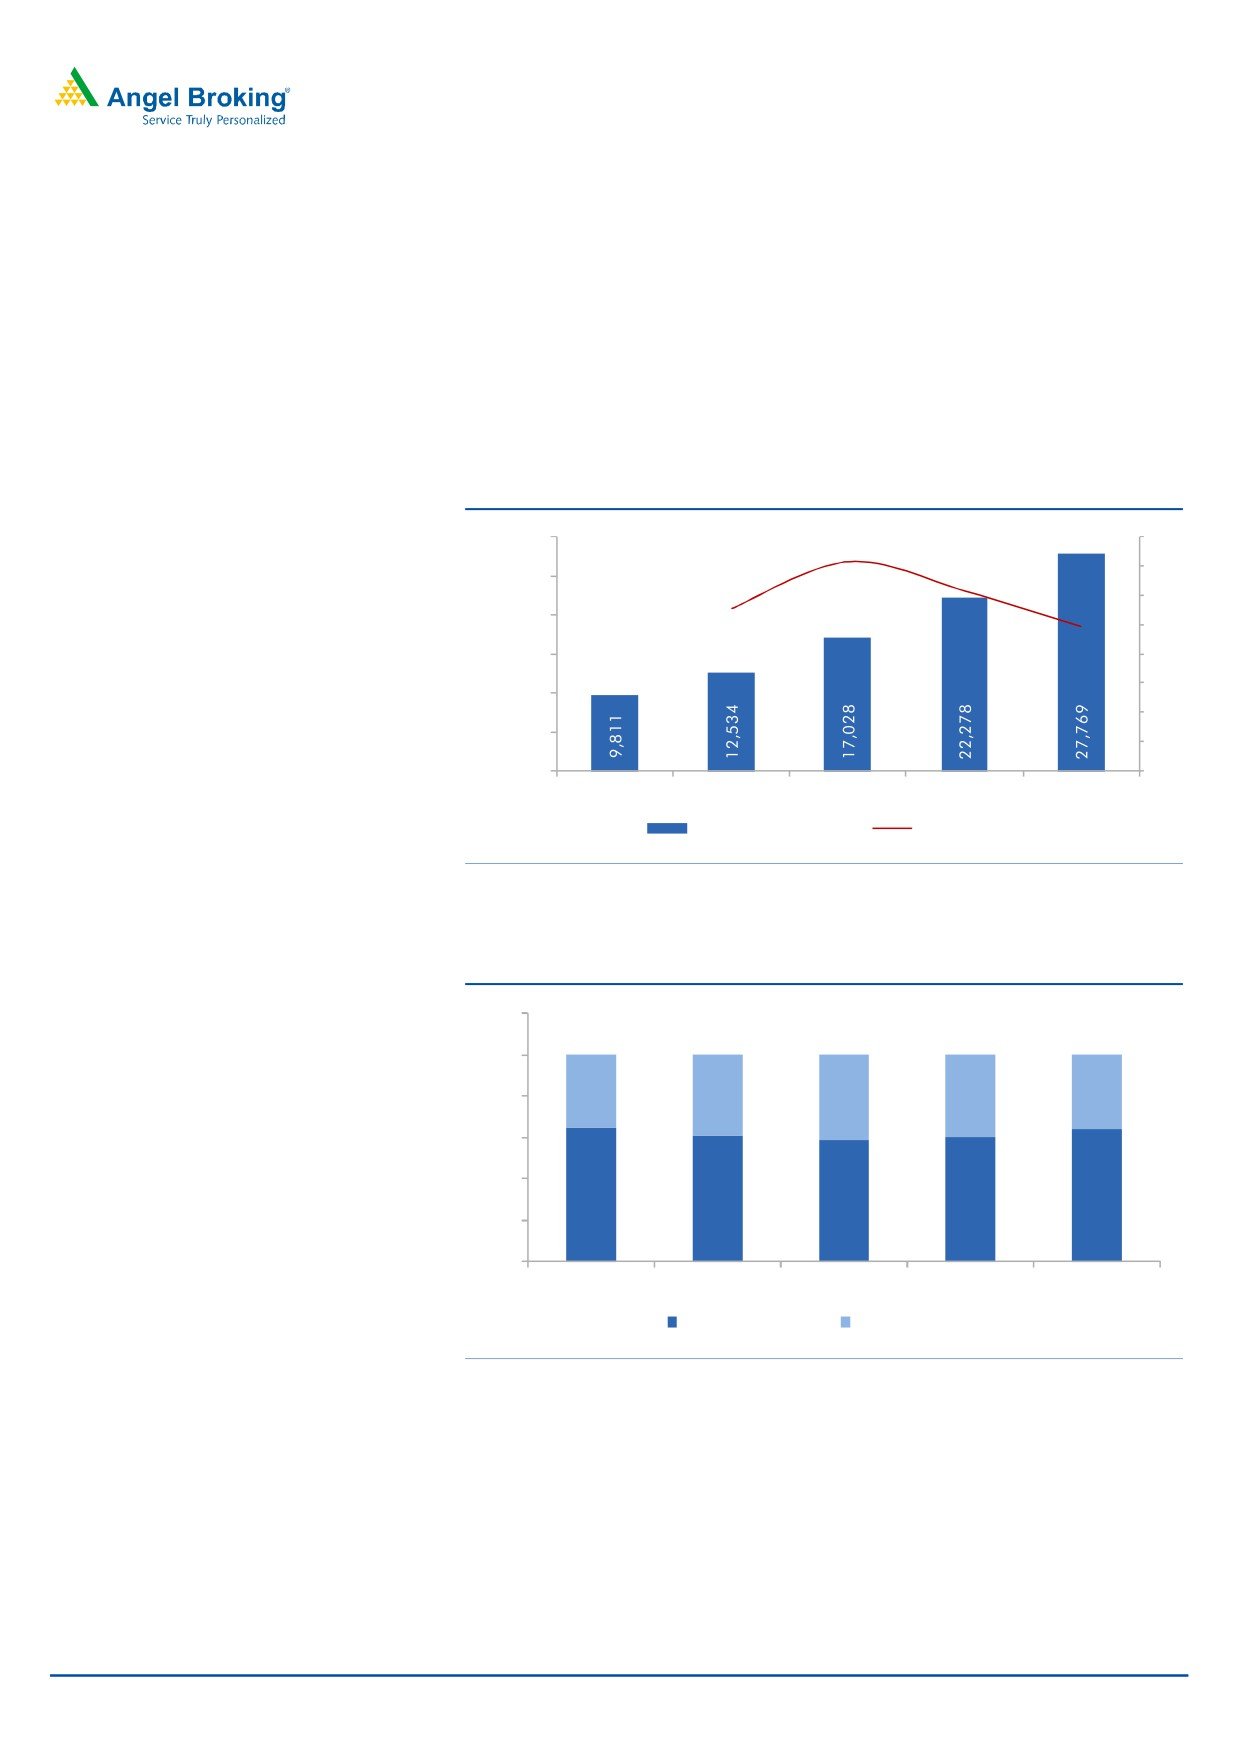
Growth has just begun for Housing Finance segment
LTFH has the potential to become a meaningful player in the housing finance
segment in the years to come. Under this segment it lends to individual home
loans, Loan Against Property (LAP) and also to developers. The segment grew by
27.8% YoY in FY2017 and accounted for 18.8% of the overall loan book. We
expect the overall Housing Finance book to report 30% CAGR over FY2017-20.
Exhibit 10: Segmental Growth Housing Loans
` Cr
FY16
FY17
FY18E
FY19E
FY20E
Retail Home Loans / LAP
6,313
7,643
9,936
13,413
17,840
% Change YoY
21.1
30.0
35.0
33.0
Real Estate Finance
3,498
4,891
7,092
8,865
9,929
% Change YoY
39.8
45.0
25.0
12.0
Total
9,811
12,534
17,028
22,278
27,769
% Growth YoY
27.8
35.9
30.8
24.6
Source: Company, Angel Research
Retail home loans/ LAP segment to see further improvement in traction: The retail
home loan segment of LTFH caters to both salaried as well non salaried-self
employed segments. However, as the margins in salaried segment are relatively
lower, hence, in order to improve its overall NIMs, the company intends to
increasingly focus more on the non salaried segment, which faces less competition
as well as offers better yield. LAP accounts for ~33% of the individual home loans
segment.
Builder’s loan segment could aid higher margins in the Housing Finance segment:
In FY2017, the loans book towards developers reported a strong growth of ~40%.
In the developer loan segment LTFH will use parent L&T domain expertise, which
will be used as the key mover for growing the housing finance space. Currently
also, the company is lending only to the Tier 1 builders after doing lot of due
diligence. While on one hand, it will lend to the developers, it will also generate
leads from the same set of developers for its retail home loans, thus enhancing its
cross selling capability.
Higher incremental business from developer loans and self employed segment
should be RoE accretive: Generally, the fee income from developer loans are
higher compared to other retail loans. Though developer loans will continue to
grow at a healthy pace its share in total loans is expected to come down gradually.
And as a result of better spread and higher fee income this is likely to result in a
sustainable 20% ROE for the segment, despite increasing competition in the retail
loans space. Further, in the home loans to the salaried segment, incrementally the
company is relying more on its own origin rather than sourcing from DSA, which
should result in lower cost.
July 07, 2017
7
L&T Finance Holdings | Initiating Coverage
AUM growth to be higher than industry growth in Housing
Finance segment
The Housing Finance segment reported a 27.8% growth in AUM in FY2017 and
we expect it to report a 30% CAGR over FY2017-20, backed by 26% and 36%
growth in Home Loans/ LAP and Developer loan segment respectively. We have
factored in a marginally higher credit cost, as the share of loans from the non
salaried segment goes up for the segment, and hence expect the PAT CAGR of
25% over the same period.
Exhibit 11: Growth in Housing Finance
30,000
35.9
24.6
40
30.8
35
25,000
27.8
30
20,000
25
15,000
20
15
10,000
10
5,000
5
-
0
FY16
FY17
FY18E
FY19E
FY20E
Housing Finance Rs Cr
% Growth YoY
Source: Company, Angel Research
Exhibit 12: Loan Bifurcation Housing Finance Segment (%)
120
100
80
36
39
36
42
40
60
40
64
61
58
60
64
20
0
FY16
FY17
FY18E
FY19E
FY20E
Home Loans / LAP
Real Estate Finance
Source: Company, Angel Research
July 07, 2017
8
L&T Finance Holdings | Initiating Coverage
Exhibit 13: Income statement Housing Loans
` Cr
FY16
FY17
FY18E
FY19E
FY20E
Interest Income
941
1,386
1,733
2,122
2,597
Interest Cost
604
832
1,100
1,332
1,611
Net Interest Income
338
554
633
790
986
Fee Income & Other income
45
90
113
138
168
Total Income
383
644
746
928
1,154
Total Operating Expenses
156
157
173
190
209
PPP
227
487
573
738
945
Provisions, contingencies & w/off
26
68
78
109
143
PBT
201
420
495
628
802
Tax
73
146
168
214
273
PAT
128
274
327
415
529
Source: Company, Angel Research
Exhibit 14: Balance Sheet Housing Finance
` Cr
FY16
FY17
FY18E
FY19E
FY20E
Closing Gross Loans & Advances
9,811
12,534
15,667
19,584
24,480
Total Assets
10,615
13,220
16,387
20,334
25,305
Closing Net worth
991
1,363
1,690
2,104
2,634
Closing Borrowing
8,829
11,115
13,782
17,227
21,534
Other Liabilities
1,786
2,106
2,605
3,107
3,771
Total Liabilities
10,615
13,220
16,387
20,334
25,305
Source: Company, Angel Research
Exhibit 15: Key Ratios Housing Finance Business
Key Assumptions
FY16
FY17
FY18E
FY19E
FY20E
Growth (% )
Loans
-
27.8
37.0
29.3
25.0
Borrowings
-
25.9
24.0
25.0
25.0
NII
-
64.0
14.2
24.8
24.8
Provisions
-
162.9
14.7
40.9
31.0
PAT
-
113.2
19.5
26.9
27.6
Key Ratios (%)
Yield on advances
12.2
12.4
12.3
12.0
11.8
Cost of funds
8.8
8.4
8.0
7.7
7.5
NIM%
4.4
5.0
4.5
4.5
4.5
Credit Cost
0.3
0.6
0.6
0.6
0.7
ROA
1.3
2.2
2.1
2.1
2.2
ROE
12.9
20.1
19.3
19.7
20.1
Source: Company, Angel Research
July 07, 2017
9
L&T Finance Holdings | Initiating Coverage
Wholesale finance to generate high fee income
The wholesale finance segment reported a 18.7% growth in AUM in FY2017 and
we expect it to report 11% CAGR over FY2017-20. The key strategy in wholesale
finance will be to originate the deal and sell the assets to other financial institutions
for some fees. LTFH is already a pioneer in lending to the renewable energy sector
and intends to capitalize on the domain knowledge it has developed over the years
in funding to the new sector where there is limited competition. Further, it also has
been financing to operating roads and transmission sectors within the wholesale
finance business.
Exhibit 16: Loan Bifurcation - Wholesale Finance
` Cr
FY16
FY17
FY18E
FY19E
FY20E
Infrastructure Finance
27,604
32,884
37,134
40,476
44,119
% Growth YoY
-
19.1
12.9
9.0
9.0
Structured Corp Finance
4,979
6,397
7,932
9,281
10,766
% Growth YoY
-
28.5
24.0
17.0
16.0
Supply Chain Finance
2,287
2,123
2,134
2,163
2,227
% Growth YoY
-
(7.2)
0.5
1.4
3.0
Total
34,870
41,404
47,200
51,920
57,112
% Growth YoY
-
18.7
14.0
10.0
10.0
Source: Company, Angel Research
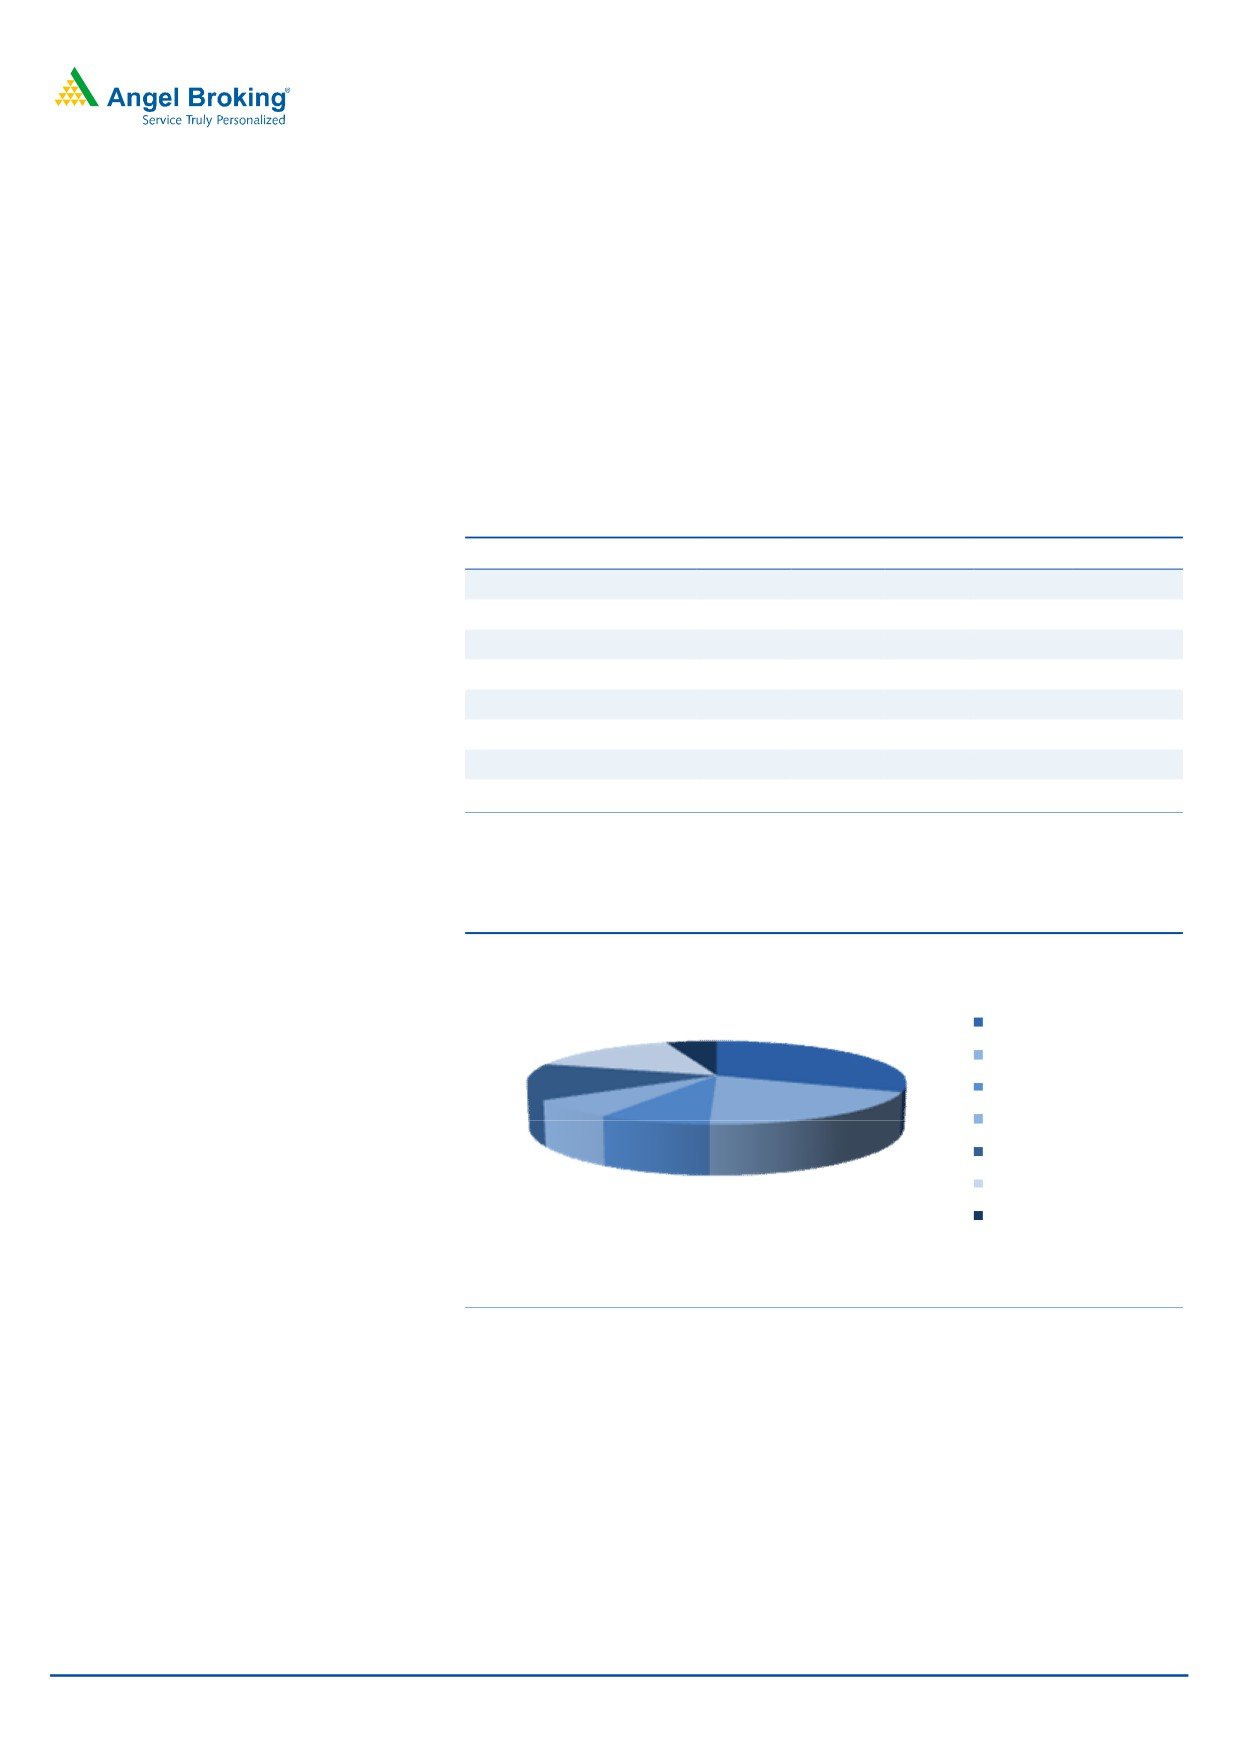
Exhibit 17: Loan Composition of Wholesale Finance
5%
Renewables
15%
31%
Transport
Power-Thermal
Power- Corporate+T&D
14%
Others
7%
19%
8%
Structured Corp Finance
Supply Chain Finance
Source: Company, Angel Research
July 07, 2017
10
L&T Finance Holdings | Initiating Coverage
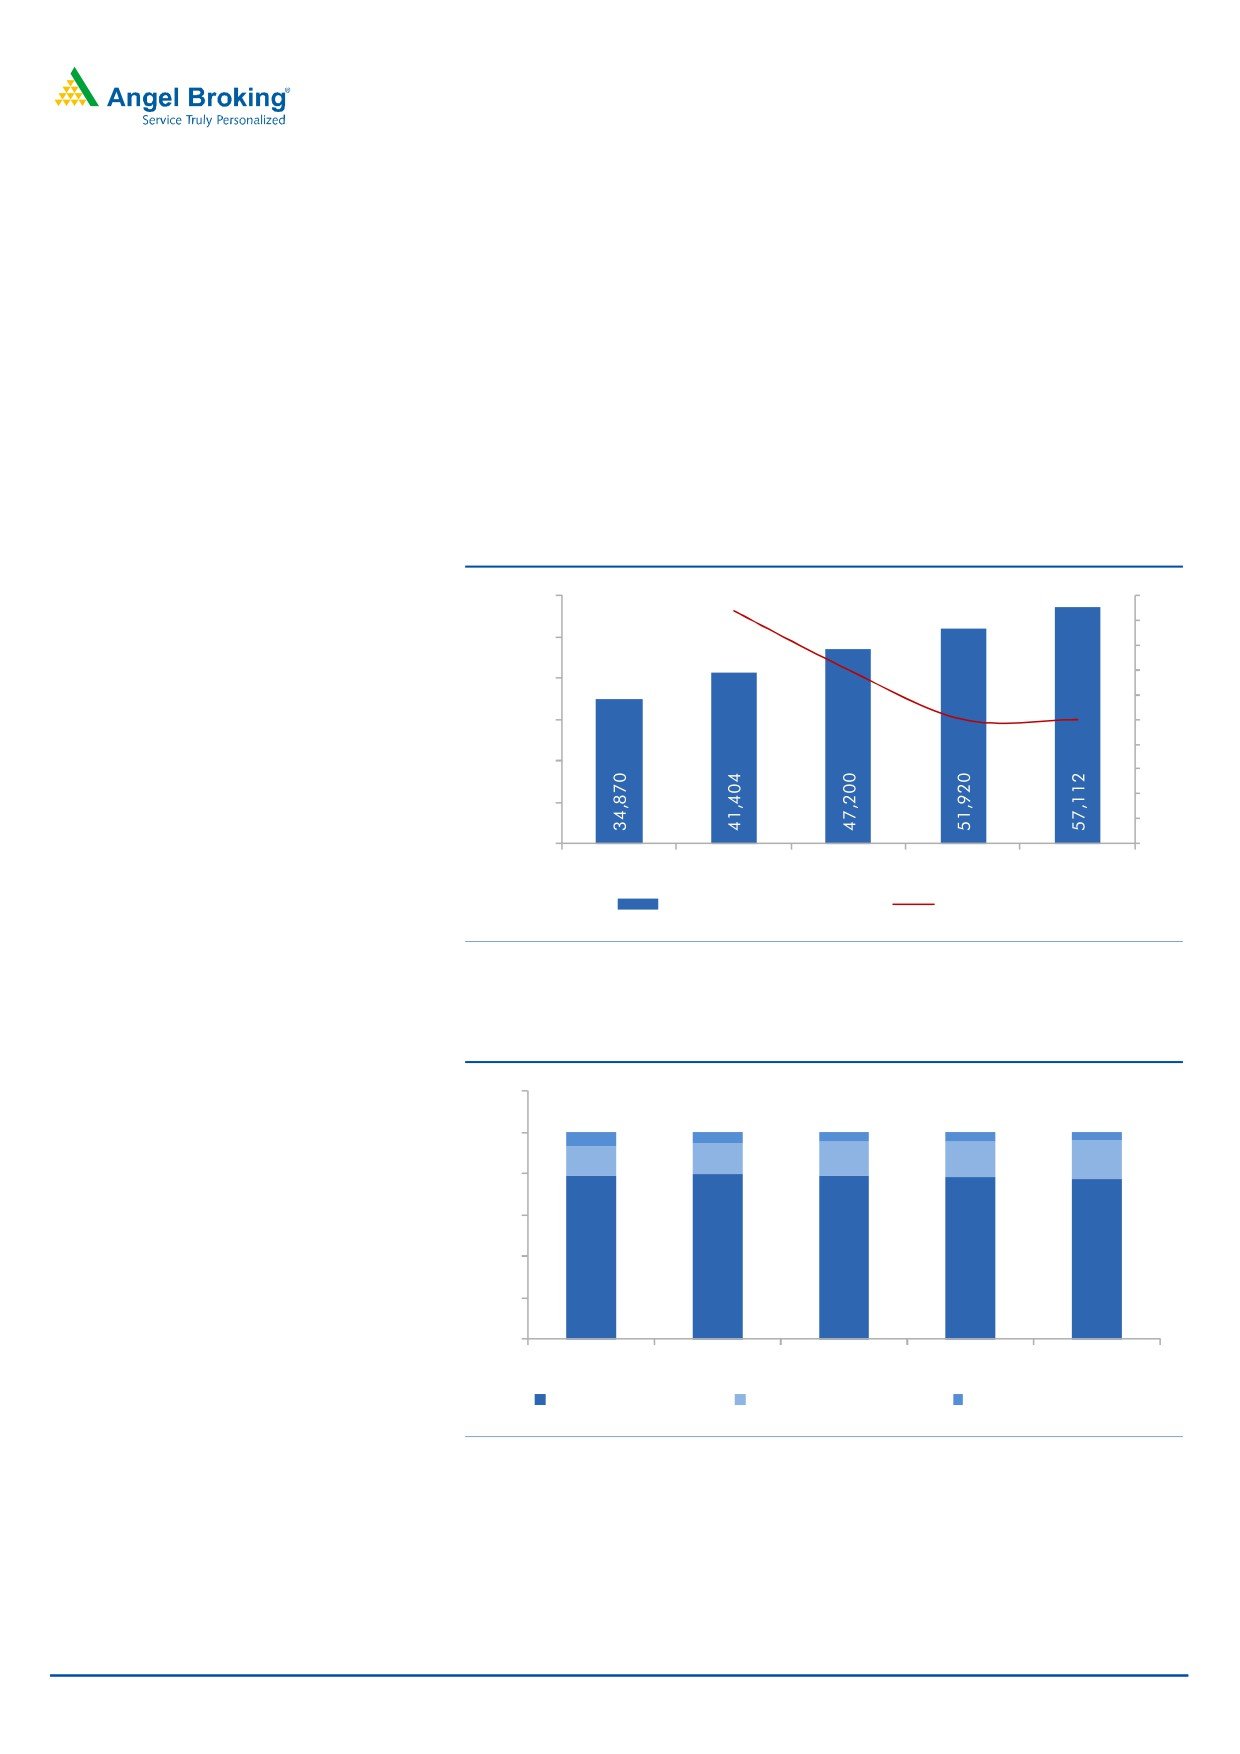
Sale down of assets will ensure higher bottom-line growth
with low capital consumption
LTFH, on the back of its strong parentage has developed strong domain
knowledge of financing the large and long gestation projects. While the assets
financed before 2011 have lot of stress, those after 2011 have been strong in
balance sheet. Going ahead, the management intends to sale down assets after
strong underwriting process. Projects which are financed have a strong cash flow
potential, and hence LTFH intends to generate strong fee income out of selling the
loans. There is strong demand for this type of transactions both from Banks and
other NBFCs.
Exhibit 18: Loan growth in Wholesale finance
18.7
60,000
20
18
14.0
50,000
16
10.0
14
40,000
10.0
12
30,000
10
8
20,000
6
4
10,000
2
-
0
FY16
FY17
FY18E
FY19E
FY20E
Wholesale Finance ( Rs Cr )
% Growth YoY
Source: Company, Angel Research
Exhibit 19: Wholesale Finance Loan Composition (%)
120
100
7
5
5
4
4
14
15
17
18
19
80
60
40
79
79
79
78
77
20
0
FY16
FY17
FY18E
FY19E
FY20E
Infrastrcature Finance
Structured Corp Finance
Supply Chain Finance
Source: Company, Angel Research
July 07, 2017
11
L&T Finance Holdings | Initiating Coverage
Exhibit 20: Income Statement Wholesale Finance
` Cr
FY16
FY17
FY18E
FY19E
FY20E
Interest Income
3,717
4,064
4,773
5,191
5,547
Interest Cost
2,429
2,736
3,372
3,663
3,953
Net Interest Income
1,288
1,328
1,401
1,528
1,593
Fee Income & Other income
144
299
404
485
582
Total Income
1,432
1,627
1,805
2,013
2,175
Total Operating Expenses
176
159
166
186
209
PPP
1,257
1,469
1,639
1,826
1,966
Provisions, contingencies & w/off
461
712
665
595
545
PBT
795
757
974
1,232
1,421
Tax
247
197
244
320
370
PAT
548
560
731
911
1,052
Source: Company, Angel Research
Exhibit 21: Balance Sheet Wholesale Finance
` Cr
FY16
FY17
FY18E
FY19E
FY20E
Closing Business Assets
34,870
41,403
47,200
51,920
57,112
Total Assets
37,026
44,111
50,124
55,078
60,523
Closing Net worth
4,591
5,316
5,864
6,548
7,337
Closing Borrowing
30,593
37,164
41,996
46,195
50,815
Other Liabilities
1,841
1,630
2,264
2,335
2,371
Total Liabilities
37,026
44,111
50,124
55,078
60,523
Source: Company, Angel Research
Exhibit 22: Key Ratios Wholesale Finance
Key Assumptions
FY16
FY17
FY18E
FY19E
FY20E
Growth (% )
Loans
-
18.7
14.0
10.0
10.0
Borrowings
-
21.5
13.0
10.0
10.0
NII
-
3.1
5.5
9.1
4.3
Provisions
-
54.3
(6.7)
(10.5)
(8.3)
PAT
-
2.1
30.5
24.7
15.4
Key Ratios (%)
Yield on advances
11.9
11.0
10.8
10.5
10.2
Cost of funds
8.8
8.4
8.0
7.9
7.8
NIM%
4.1
3.6
3.2
3.1
2.9
Credit Cost
1.5
1.9
1.5
1.2
1.0
ROA
1.6
1.5
1.5
1.8
1.8
ROE
10.7
10.5
11.7
13.3
13.7
Source: Company, Angel Research
July 07, 2017
12
L&T Finance Holdings | Initiating Coverage
Worst in terms of asset quality is over
While the reported GNPA of LTFH is at 4.9%, including the restructured loans the
gross impaired assets is at 9.8%. Large part of the stress is from the legacy assets
financed prior to 2011, while the new assets financed in the wholesale financed
segment have negligible NPAs. Further, incrementally the company’s focus is on retail
space and the granular nature of book will ensure lower slippages and NPAs in turn.
We expect the GNPAs and NNPAs levels to gradually come down to 3.75% and 2%
of the book by FY2020 respectively.
Exhibit 23: Asset Quality (` Cr)
4,000
3,553
3,367
3,296
3,500
3,146
3,000
2,756
2,500
2,144
1,791
1,854
1,895
2,000
1,799
1,500
1,000
500
-
FY16
FY17
FY18E
FY19E
FY20E
GNPAs Rs Cr NNPAs Rs Cr
Source: Company, Angel Research
Exhibit 24: Asset Quality Trend
6.0
4.9
5.0
4.7
5.0
4.0
3.8
3.8
4.0
2.9
3.0
2.5
2.3
2.0
2.0
1.0
0.0
FY16
FY17
FY18E
FY19E
FY20E
GNPAs %
NNPAs %
Source: Company, Angel Research
July 07, 2017
13
L&T Finance Holdings | Initiating Coverage
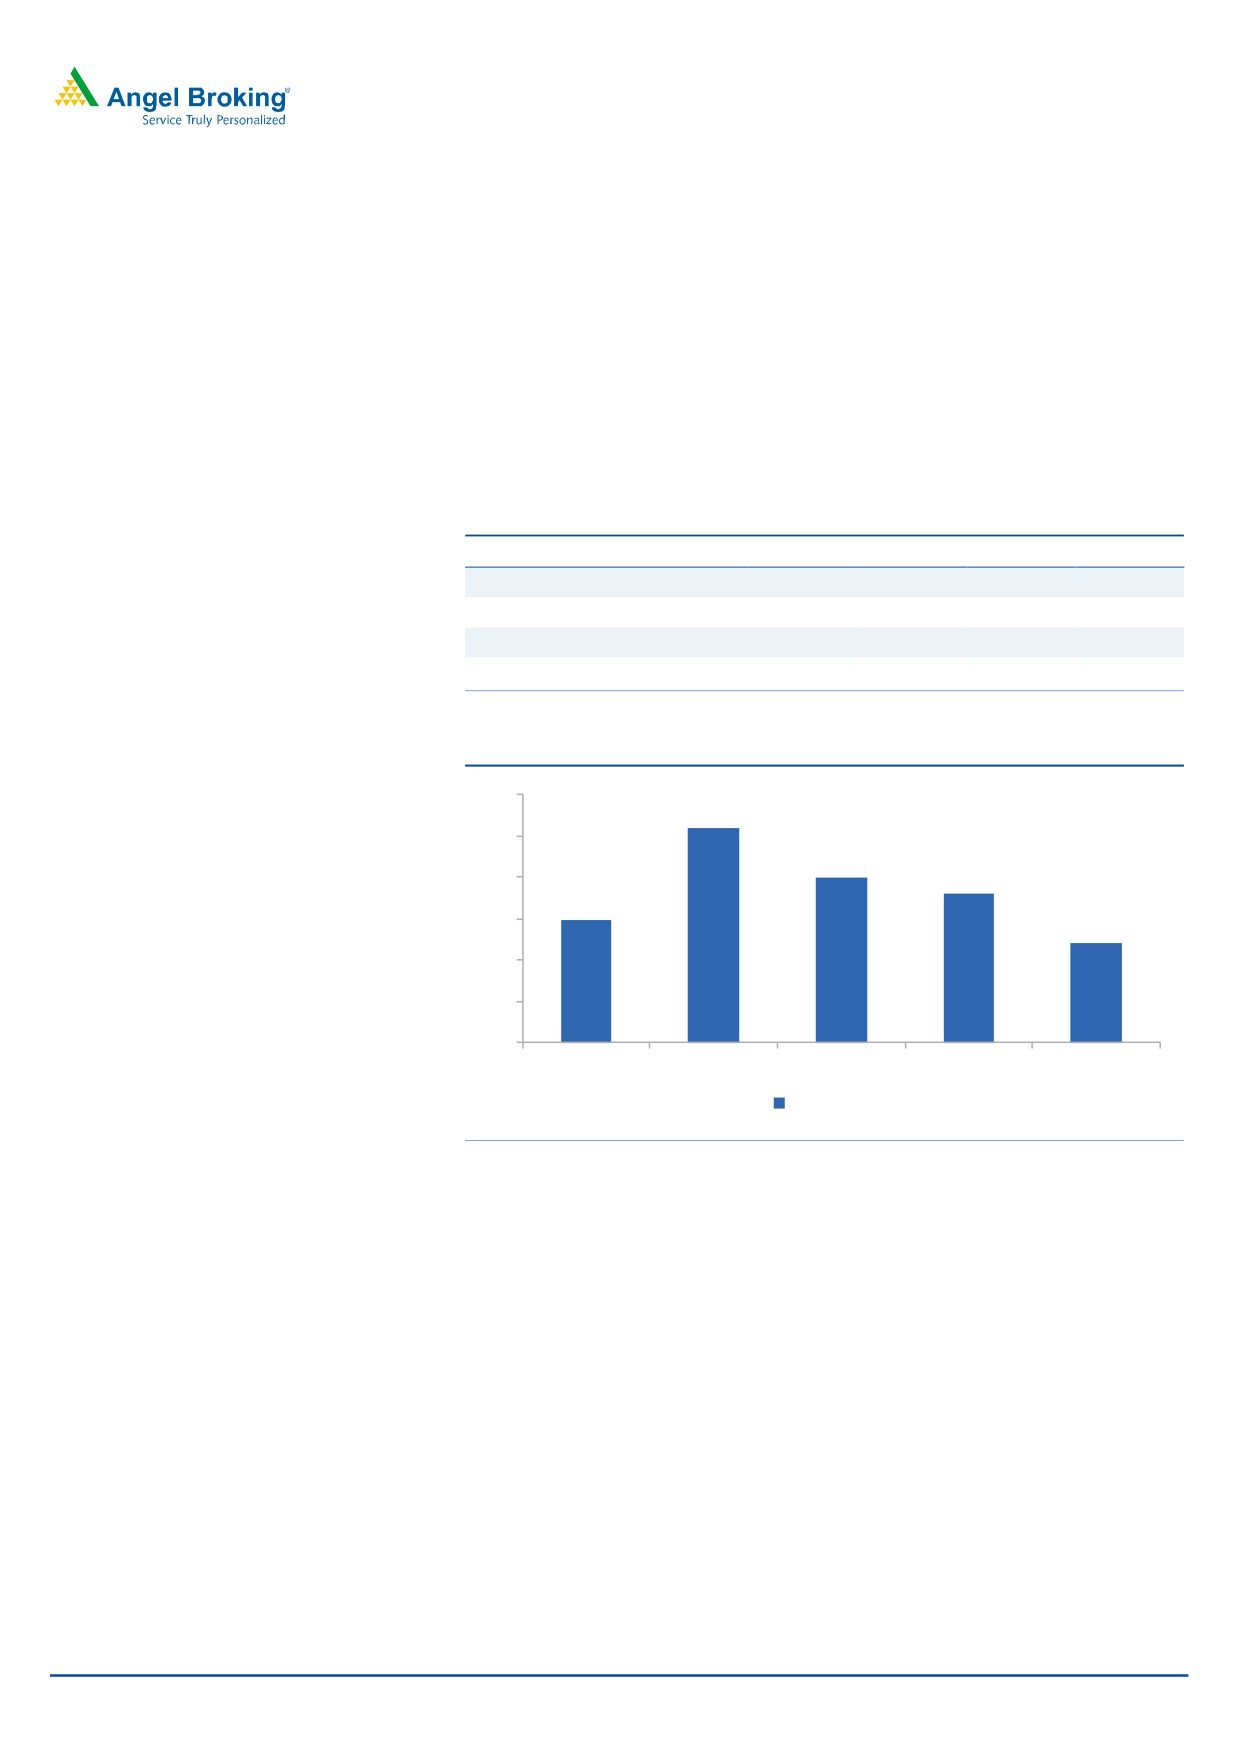
Overall credit cost should moderate going ahead
The nature of rural finances is of higher credit costs, which will remain high going
ahead as well. Nonetheless, historically the credit cost for housing finance has
always been lower and under control. The credit cost for the wholesale finance had
been higher over the last two years and might remain higher in FY2018 as well,
we expect the same to moderate going ahead. We expect the blended credit cost
to decline to 1.8% by FY2020 from 2.4% in FY2017. Further, LTFH has increased
its provision coverage ratio on the wholesale book and the blended PCR is likely to
further improve going ahead.
Exhibit 25: Segmental Credit Cost (%)
FY16
FY17
FY18E
FY19E
FY20E
Rural Finance
4.28
4.61
4.50
4.50
4.50
Housing Finance
0.33
0.61
0.55
0.62
0.65
Wholesale Finance
1.47
1.92
1.50
1.20
1.00
Blended Credit Cost
1.49
2.60
2.00
1.80
1.20
Source: Company, Angel Research
Exhibit 26: Credit Cost Trend (%)
3.0
2.6
2.5
2.0
2.0
1.8
1.5
1.5
1.2
1.0
0.5
0.0
FY16
FY17
FY18E
FY19E
FY20E
Credit Cost %
Source: Company, Angel Research
July 07, 2017
14
L&T Finance Holdings | Initiating Coverage
Increasing provision should take care of the impaired assets
While the company has already taken extra voluntary provisions with slippages
remaining under control, overall asset quality trend should remain positive going
ahead. LTFH merged two of its 100% subsidiaries with itself and since the
companies were valued at a premium to their book value there was goodwill to the
tune of `3000cr on account of this. Amortization of goodwill is tax deductible
expenditure and the company intends to use this as an extra provision in its books.
Lower PCR was one of the concerns for LTFH’s book, particularly on the wholesale
finance side. However, it has already increased its PCR on the book and we expect
the same to go up further.
Exhibit 27: PCR Trend (%)
50
46.8
46.7
43.8
42.8
45
40
35
30
25
22.2
20
15
10
5
0
FY16
FY17
FY18E
FY19E
FY20E
PCR %
Source: Company, Angel Research
July 07, 2017
15
L&T Finance Holdings | Initiating Coverage
Shift towards higher yielding assets and lower credit cost to
result in RoE improvement
LTFH’s move to scale down its book on certain products which were making losses
and the renewed focus on increasing share of high yielding assets like Rural
Finance and Housing Finance segments have started paying off. Further, it has
already taken voluntary provisions to cover the impaired assets from the wholesale
book. Despite this, it ended FY2017 with a RoE of 13.8% v/s. 11.9% with
4QFY2017 hitting a high of 14.7%. With increasing sale down of assets in the
wholesale book, the fee income will get a boost and this is likely to have positive
impact on the RoE. We expect the blended RoE of LTFH to hit ~18% by FY2020.
Exhibit 28: ROE Trend (%)
20.0
17.9
18.0
15.5
16.0
13.8
14.1
14.0
11.9
12.0
10.0
8.0
6.0
4.0
2.0
0.0
FY16
FY17
FY18E
FY19E
FY20E
ROE
Source: Company, Angel Research
Exhibit 29: ROA Trend (%)
2.5
2.1
1.9
2.0
1.7
1.7
1.6
1.5
1.0
0.5
0.0
FY16
FY17
FY18E
FY19E
FY20E
ROA
Source: Company, Angel Research
July 07, 2017
16
L&T Finance Holdings | Initiating Coverage
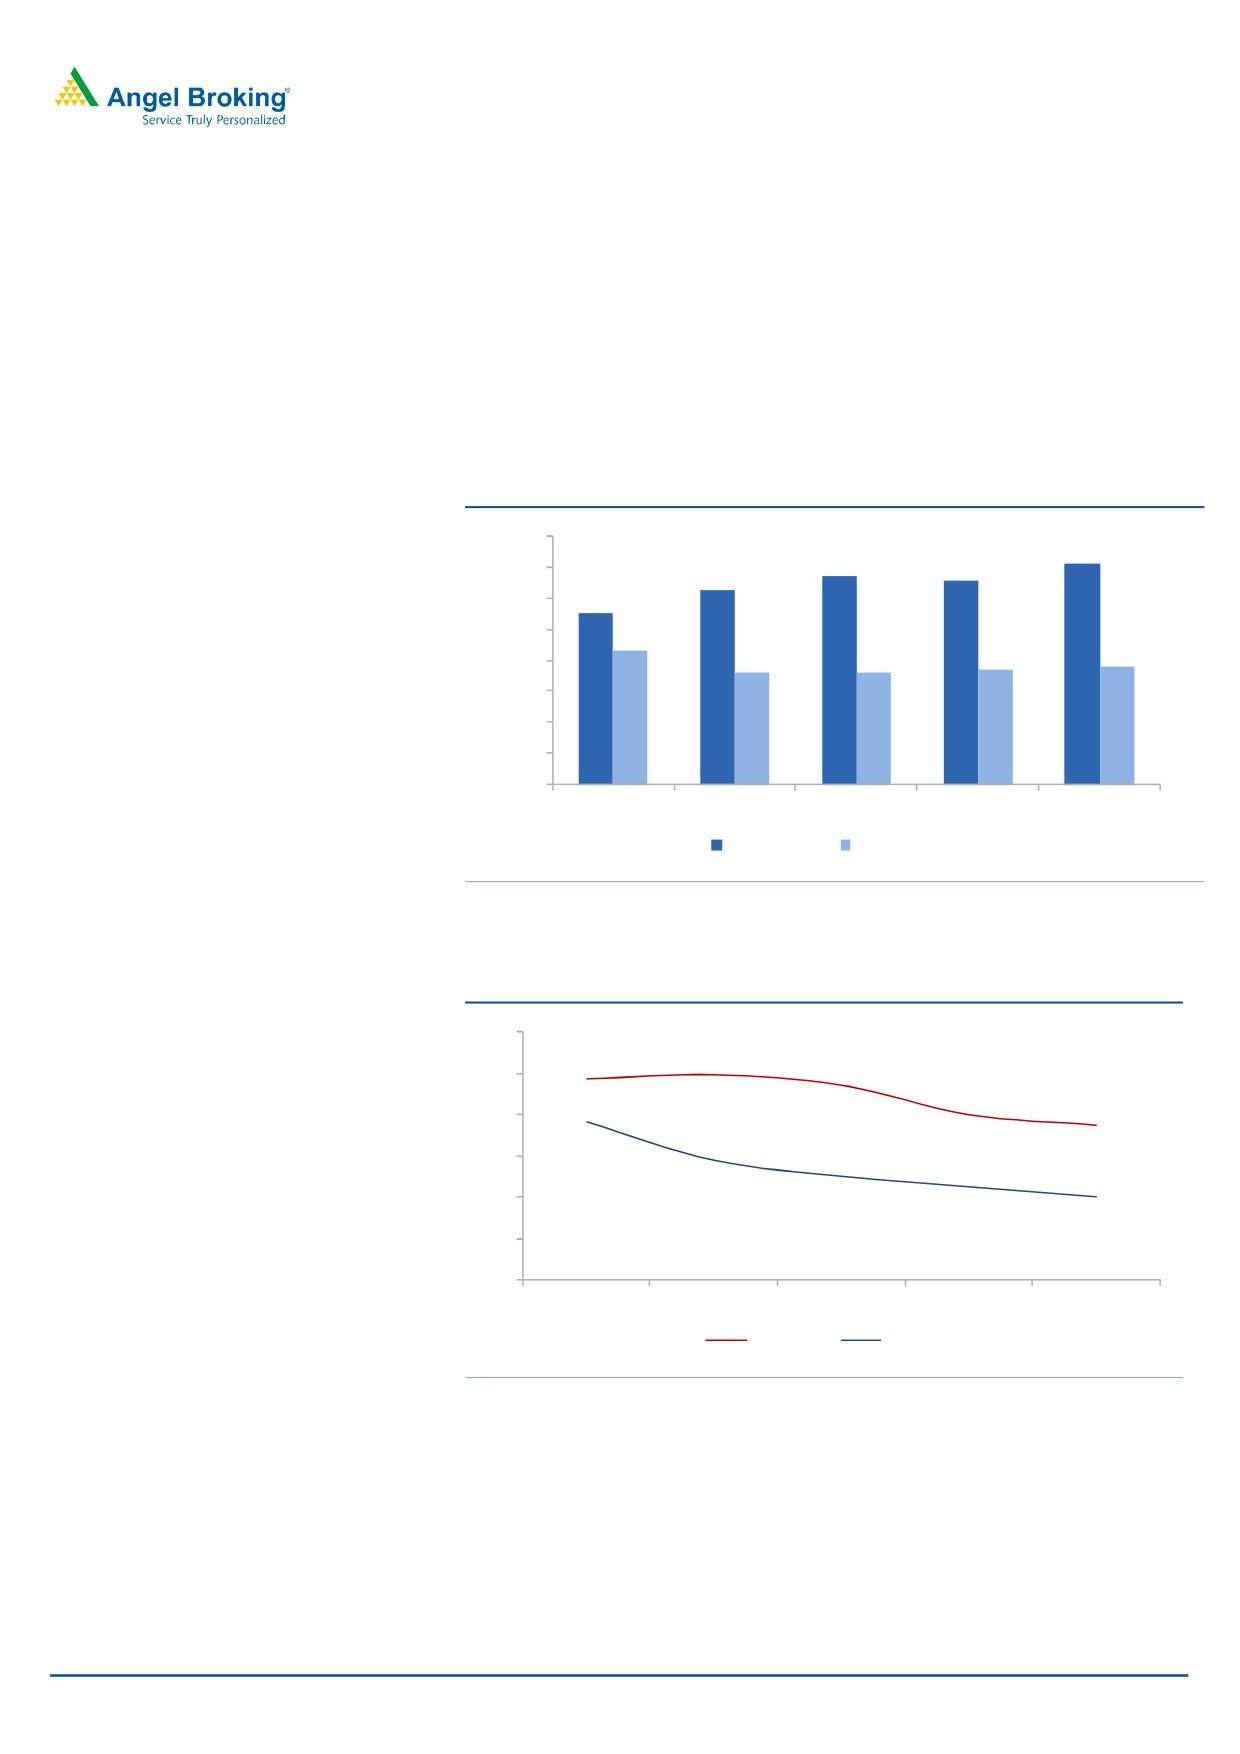
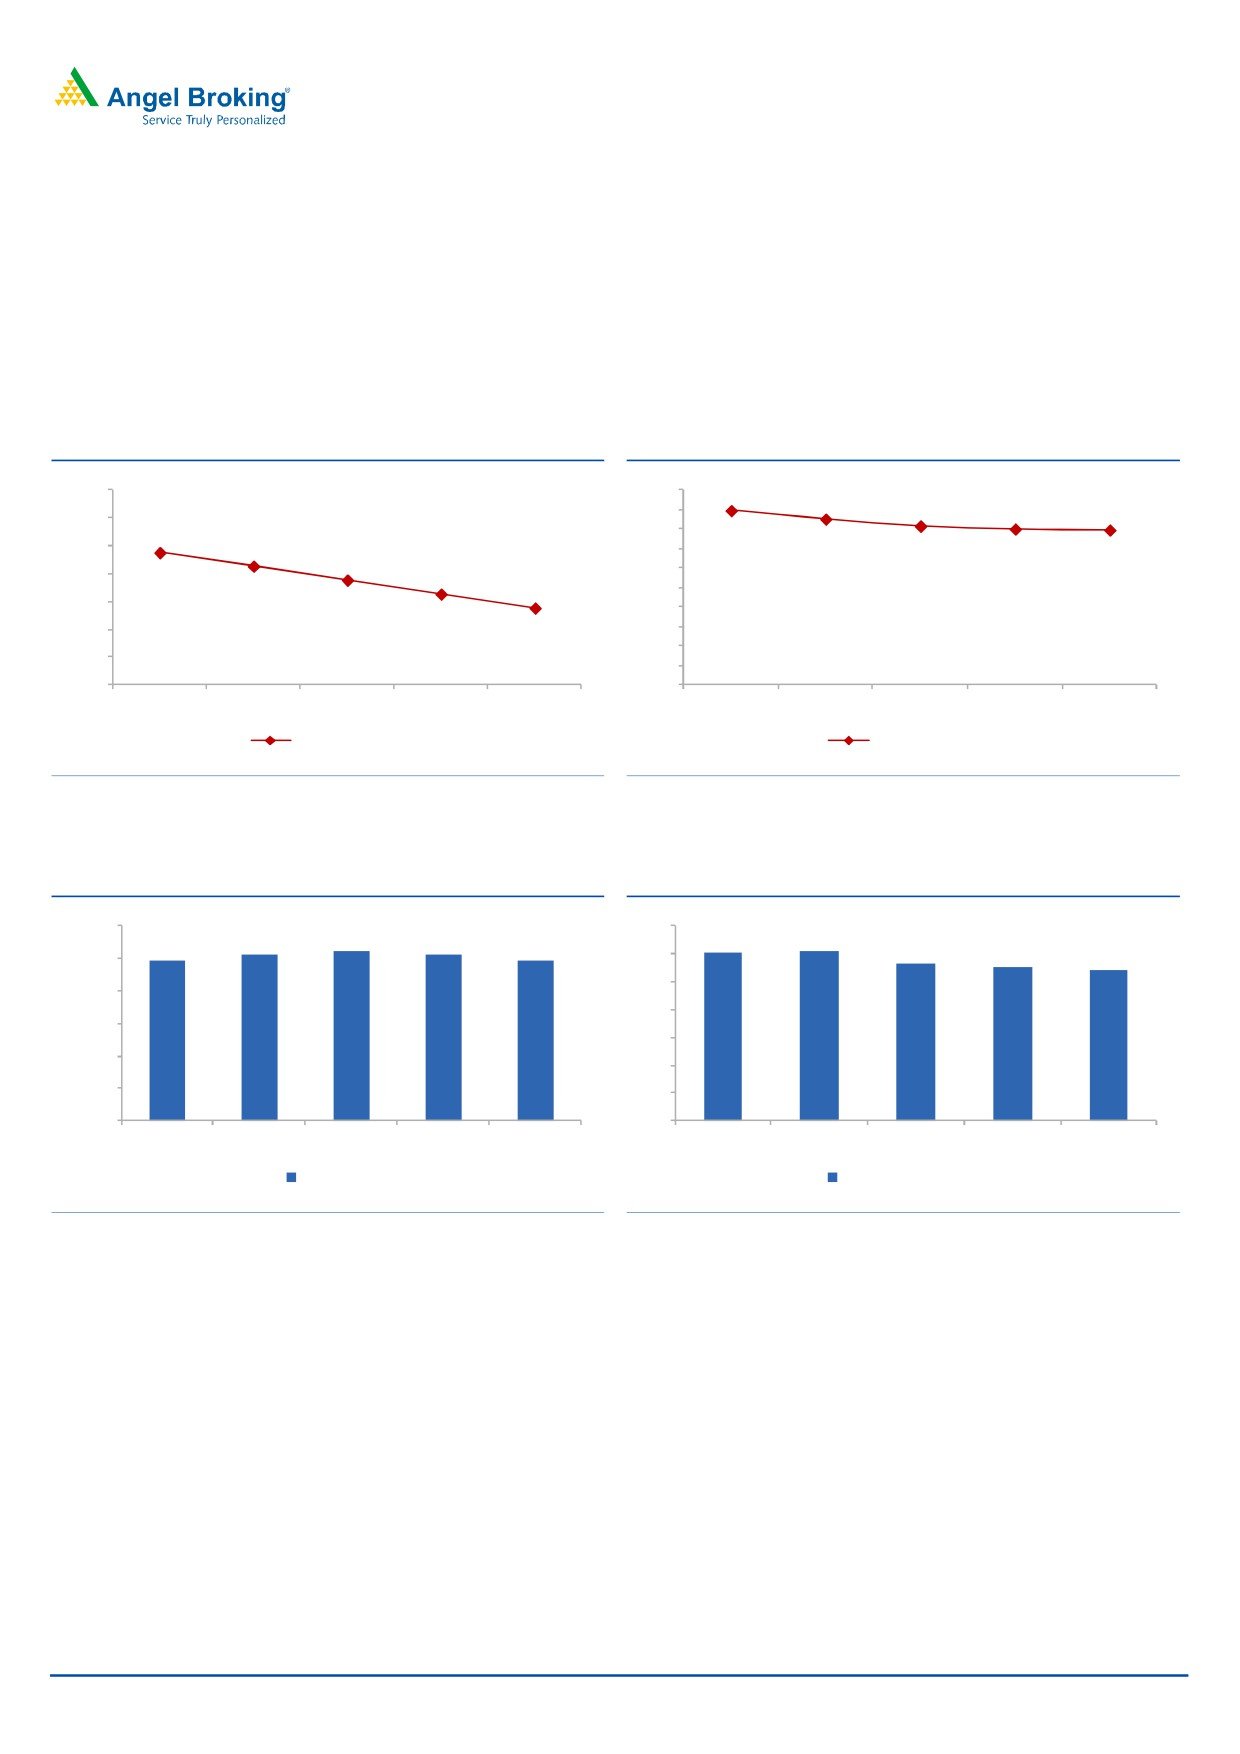
NIM to see marginal drop, still remain healthy: LTFH has historically enjoyed
strong NIM due to its presence in the rural finance segment, which generates
higher yield. While there has been a drop in the blended yield off late, it has also
witnessed reduction in the cost of funds, and hence, NIM improved in FY2017.
However, on conservative basis we have factored in further drop in yield due to
competition in housing finance segment and rural finance segment, where other
NBFCs and Small Finance Banks are also gearing up to scale up aggressively.
Exhibit 30: Yield (%)
Exhibit 31: Cost of funds (%)
15.0
10
8.94
8.50
8.15
8.00
9
7.95
14.5
13.9
8
14.0
13.6
7
13.4
13.5
13.1
6
12.9
5
13.0
4
12.5
3
2
12.0
1
11.5
-
FY16
FY17
FY18E
FY19E
FY20E
FY16
FY17
FY18E
FY19E
FY20E
Yield on assets(%)
Cost of funds (%)
Source: Company, Angel Research
Source: Company, Angel Research
Exhibit 32: Spread (%)
Exhibit 33: NIM Trend (%)
6.00
7
5.13
5.23
5.13
6.02
6.07
4.93
4.93
6
5.62
5.55
5.44
5.00
5
4.00
4
3.00
3
2.00
2
1.00
1
-
-
FY16
FY17
FY18E
FY19E
FY20E
FY16
FY17
FY18E
FY19E
FY20E
Spread ( %)
Net Interest Margin(%)
Source: Company, Angel Research
Source: Company, Angel Research
July 07, 2017
17
L&T Finance Holdings | Initiating Coverage
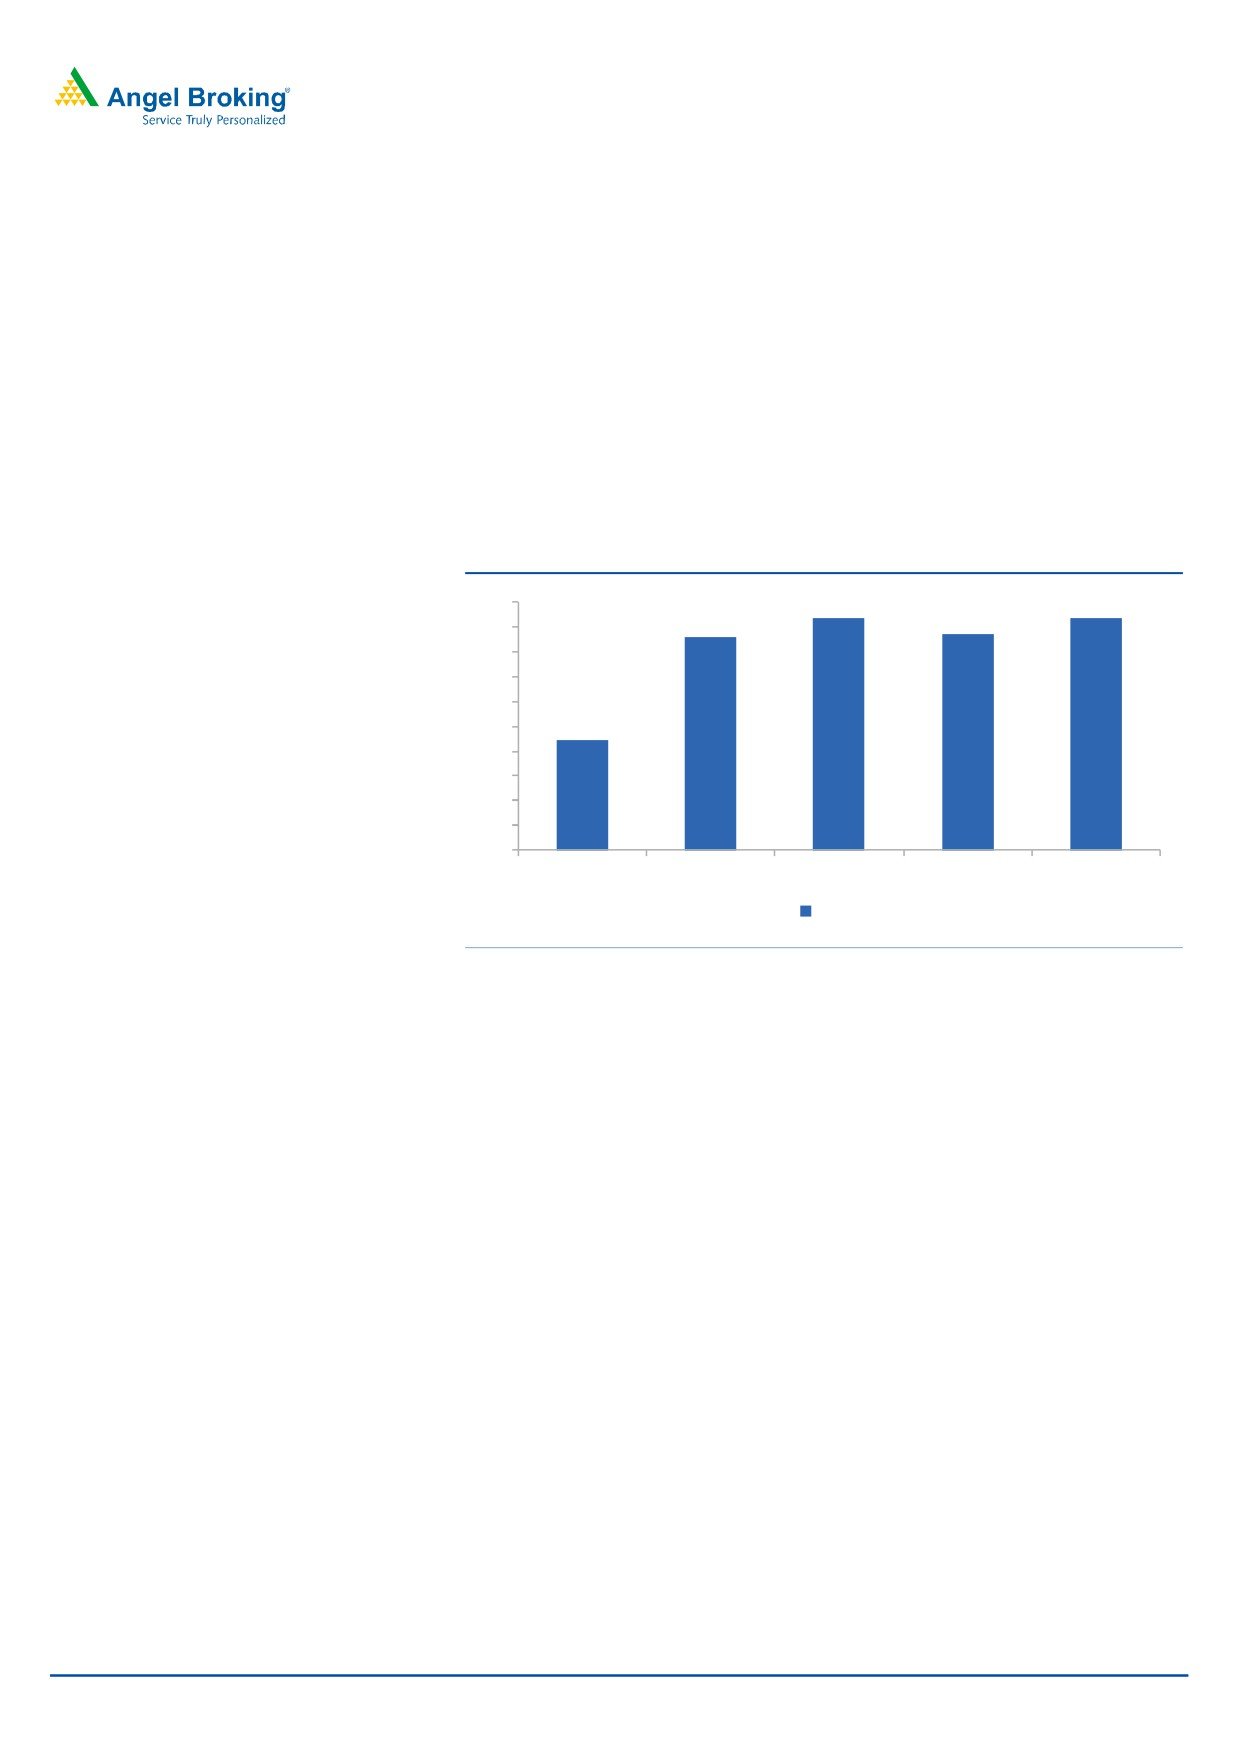
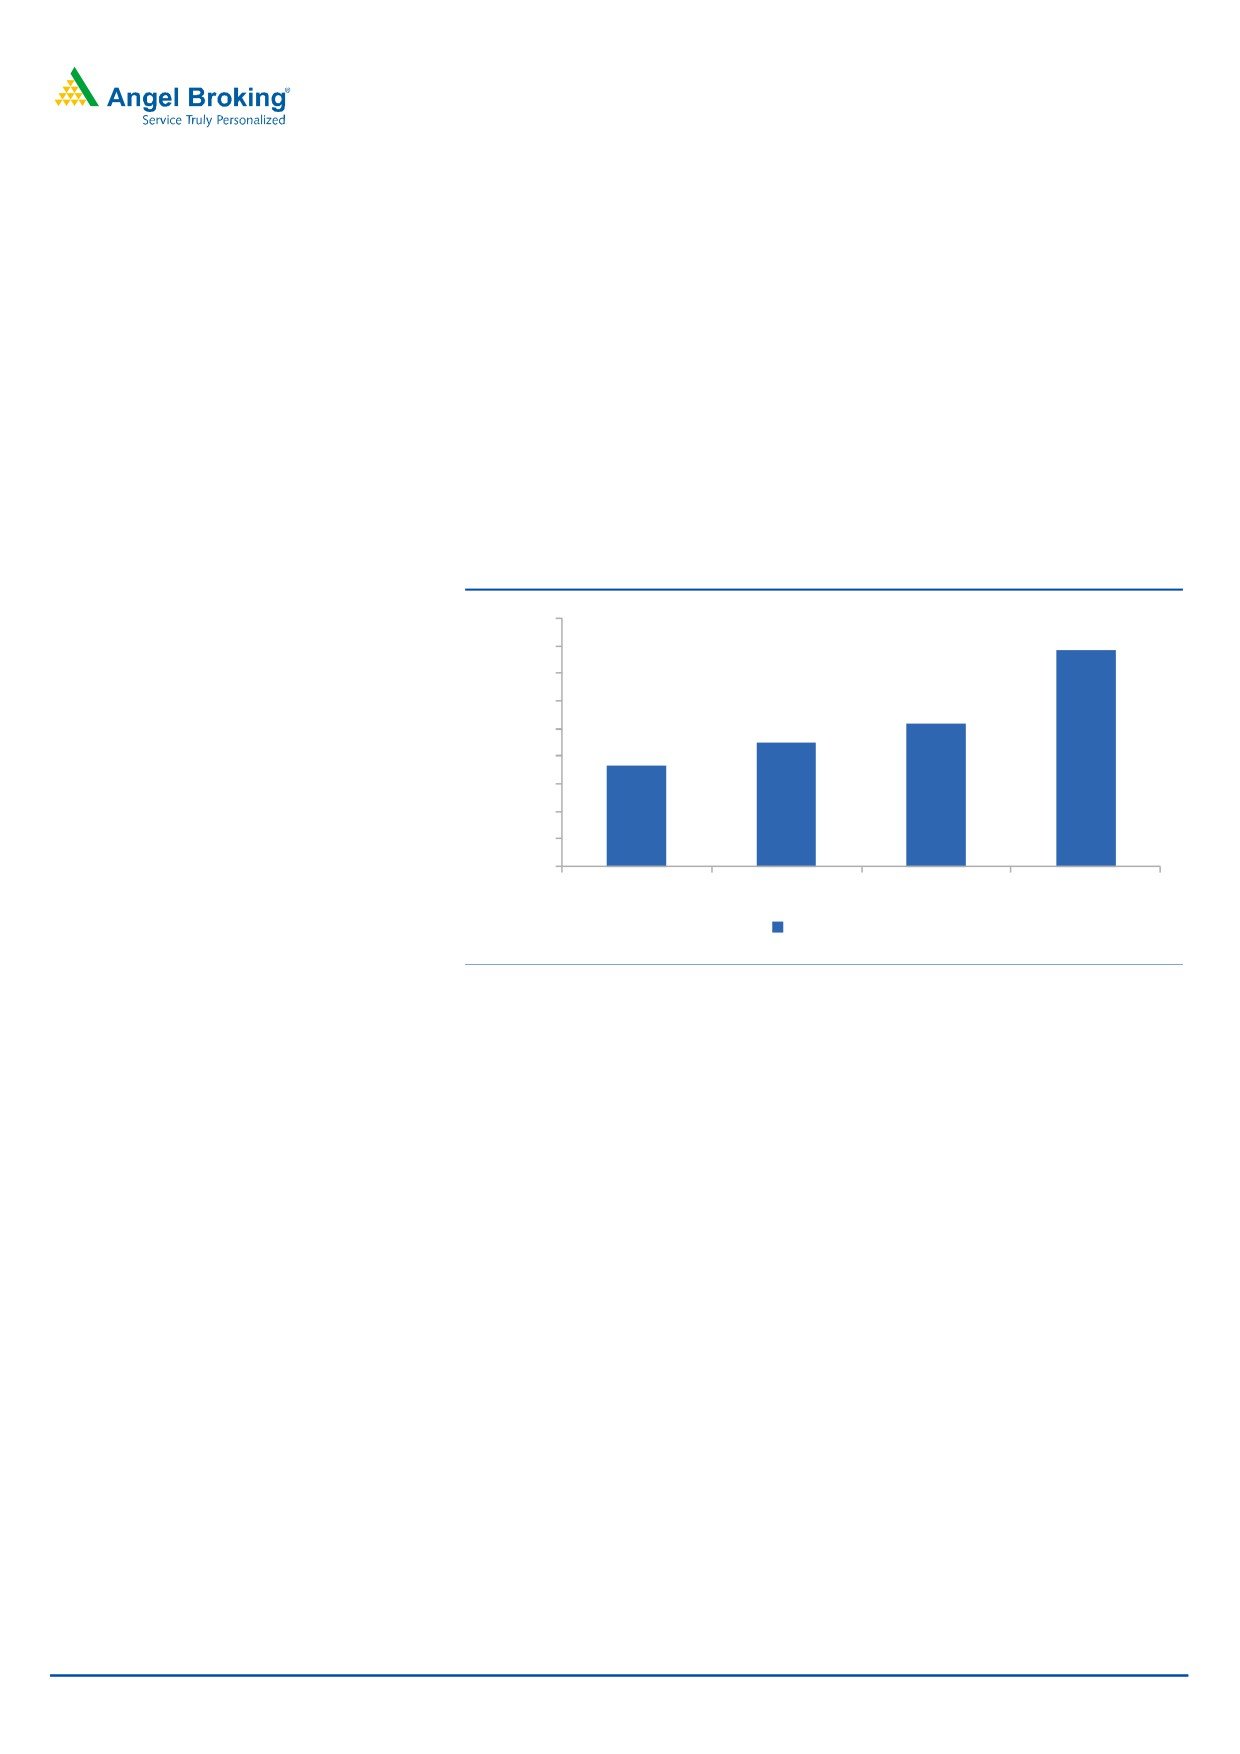
Investment management & wealth management, will aid to the profitability as
well
In 2012, L&T Mutual Fund bought the Indian Operations of Fidelity Mutual
Fund, which had an AUM of ~`8,881cr at that time. Nearly 38% Fidelity’s
total AUM was towards Equity and as a result today also L&T’s overall Equity
exposure in the total AUM at 39% stands higher than industry. In FY17, the
average AUM of L&T AMC has gone up by 51%. While on one hand, it has
been able to increase its AUM, simultaneously it has reduced the costs and
hence, the cost/ income for the investment management business have come
down to 66% by FY2017 from a high of 83% earlier. In FY17, the division
posted PAT of `45cr v/s. `16cr in FY16. Further, the wealth management
segment of the company has also been reporting improved numbers and
reported a PAT of `5cr for FY17 compared to a loss of `24cr in FY16.
Exhibit 34: Increasing AUM (` Cr)
45,000
39,300
40,000
35,000
30,000
25,945
25,000
22,496
18,255
20,000
15,000
10,000
5,000
-
FY14
FY15
FY16
FY17
Average AUM
Source: Company, Angel Research
July 07, 2017
18
L&T Finance Holdings | Initiating Coverage
Outlook and valuation
As LTFH has multiple segments of operations, we have valued it based on SOTP.
We have valued the rural finance segment at 2.5x while the housing finance and
wholesale finance has been valued at 3x and 2x its FY20E BV each. LTFH’s AMC
arm, L&T MF has been valued at 5% of average AUM. Accordingly, we have
arrived at a fair value of `179 based on SOTP, and hence recommend BUY on the
stock.
Exhibit 35: SOTP Valuation
Based on FY20E (` Cr)
Net Worth
Multiple Implied Mkt Cap
Rural
2,694
2.5
6,736
Housing
2,634
3.0
7,901
Whole sale
7,337
2.0
14,674
Combined Value of Lending Business
29,311
Value of MF @ 5% of AUM
1,965
Implied Market Cap
31,276
Implied Per Share
179
CMP
149
% Upside
20%
Source: Company, Angel Research
Exhibit 36: Comparative Valuation & Return ratio
P/BV
RoE%
RoA%
FY17
FY18E
FY19E
FY17
FY18E
FY19E
FY17
FY18E
FY19E
L&T Fin
3.3
2.8
2.5
13.8
14.1
15.5
1.7
1.7
1.9
M&M Fin
2.9
2.6
2.3
7.6
14.7
17.4
1.0
2.0
2.2
Cholamandalam
4.2
3.6
3.1
16.9
18.3
18.9
2.3
2.5
2.6
Shriram City
3.2
2.9
2.5
11.8
15.6
16.6
2.4
3.0
3.0
Magma Fin
1.8
1.7
1.5
1.0
10.5
11.7
0.1
1.5
1.7
REPCO Home
4.6
3.8
3.2
17.6
19.5
20.6
2.4
2.5
2.6
Shriram Transport Fin
2.2
2.0
1.7
11.8
14.1
16.1
1.8
2.2
2.6
Sundaram Fin
3.7
3.5
3.1
15.2
15.6
16.7
2.3
2.4
2.6
Source: Company, Angel Research, Note: CMP as of July 06, 2017, * other NBFCs Consensus taken from Bloomberg,
July 07, 2017
19
L&T Finance Holdings | Initiating Coverage
Exhibit 37: Income Statement ( Consolidated)
` Cr
FY16
FY17
FY18E
FY19E
FY20E
NII
3,165
3,714
4,006
4,552
5,181
- YoY Growth (%)
20.4
17.3
7.9
13.6
13.8
Other Income
182
232
324
422
548
- YoY Growth (%)
28.8
27.4
40.0
30.0
30.0
Operating Income
3,347
3,945
4,330
4,974
5,729
- YoY Growth (%)
20.8
17.9
9.8
14.9
15.2
Operating Expenses
1,313
1,277
1,404
1,545
1,699
- YoY Growth (%)
21.9
-2.8
10.0
10.0
10.0
Pre - Provision Profit
2,034
2,669
2,926
3,430
4,030
- YoY Growth (%)
20.2
31.2
9.7
17.2
17.5
Prov. & Cont.
781
1,590
1,526
1,587
1,492
- YoY Growth (%)
18.0
103.6
(4.0)
4.0
(6.0)
Profit Before Tax
1,253
1,079
1,400
1,843
2,538
- YoY Growth (%)
21.5
(13.9)
29.8
31.6
37.7
Prov. for Taxation
399
36
190
323
531
- as a % of PBT
23.1
(90.9)
422.0
69.9
64.6
PAT
854
1,043
1,210
1,520
2,006
- YoY Growth (%)
20.8
22.1
16.1
25.6
32.0
Source: Company, Angel Research
Exhibit 38: Balance Sheet ( Consolidate)
Y/E March ( ` cr)
FY16
FY17
FY18E
FY19E
FY20E
Share Capital
1,754
1,756
1,820
1,820
1,820
Reserve & Surplus
5,324
6,020
7,433
8,583
10,138
Net Worth
7,195
7,894
9,253
10,403
11,958
Preference Shares
1,213
1,213
1,213
1,213
1,213
Minority Interest
100
119
119
119
119
Borrowings
51,616
59,811
67,935
77,786
89,065
- Growth (%)
15.9
13.6
14.5
14.5
Other Liabilities
2,961
3,035
3,131
3,444
3,789
Total Provisions
645
367
393
422
454
Others
70
75
75
75
75
Total Liabilities
63,801
72,514
82,120
93,463
1,06,672
Cash and Cash equivalents
402
594
654
719
791
Investments
3,563
6,012
6,072
6,375
6,694
Total Loans & Advances
56,065
61,649
71,314
82,058
95,187
- Growth (%)
10.0
15.7
15.1
16.0
Fixed Assets
696
619
631
644
657
Good Will on consolidation
639
639
639
639
639
Others
1,074
1,487
1,509
1,532
1,557
Other Assets
1,361
1,514
1,301
1,496
1,148
Total Assets
63,801
72,514
82,120
93,463
1,06,672
Source: Company, Angel Research
July 07, 2017
20
L&T Finance Holdings | Initiating Coverage
Exhibit 39: Key Ratios ( Consolidated)
FY16
FY17
FY18E
FY19E
FY20E
Profitability ratios (%)
NIMs
6.0
6.1
5.6
5.5
5.4
RoA
1.6
1.7
1.7
1.9
2.1
RoE
11.9
13.8
14.1
15.5
17.9
Asset Quality (%)
Gross NPAs
2,756
3,146
3,352
3,282
3,570
Gross NPAs %
4.9
4.9
4.7
4.0
3.8
Net NPAs
2,144
1,799
1,783
1,846
1,904
Net NPAs %
3.8
2.9
2.5
2.3
2.0
Credit Cost
1.5
2.6
2.0
1.8
1.2
PCR %
22.2
42.8
46.8
43.8
46.7
Per Share Data (`)
EPS
4.9
5.9
6.9
8.7
11.4
BVPS
41.0
45.0
52.7
59.3
68.1
Adj BV
28.8
34.7
42.6
48.8
57.3
DPS
0.8
0.8
1.0
1.8
2.2
Valuation Ratios
PER (x)
30.4
24.9
21.5
17.1
12.9
P/BVPS (x)
3.6
3.3
2.8
2.5
2.2
P/ABVPS (x)
5.1
4.3
3.5
3.0
2.6
Dividend Yield (%)
0.5
0.5
0.7
1.2
1.5
DuPont Analysis
Interest Income
13.9
13.6
13.4
13.1
12.9
Interest Expenses
7.9
7.6
7.8
7.6
7.4
NII
6.0
6.1
5.6
5.5
5.4
Other Inc.
0.3
0.4
0.5
0.5
0.6
Total Income
6.4
6.4
6.1
6.1
6.0
Opex
2.5
2.1
2.0
1.9
1.8
PPP
3.9
4.4
4.1
4.2
4.2
Provision
1.5
2.6
2.1
1.9
1.6
PBT
2.4
1.8
2.0
2.2
2.7
Taxes
0.8
0.1
0.3
0.4
0.6
RoA
1.6
1.7
1.7
1.9
2.1
Leverage
14.6
8.1
8.3
8.3
8.5
RoE
11.9
13.8
14.1
15.5
17.9
Source: Company, Angel Research
July 07, 2017
21
L&T Finance Holdings | Initiating Coverage
Research Team Tel: 022 - 39357800
DISCLAIMER
Angel Broking Private Limited (hereinafter referred to as “Angel”) is a registered Member of National Stock Exchange of India Limited,
Bombay Stock Exchange Limited and Metropolitan Stock Exchange Limited. It is also registered as a Depository Participant with CDSL
and Portfolio Manager with SEBI. It also has registration with AMFI as a Mutual Fund Distributor. Angel Broking Private Limited is a
registered entity with SEBI for Research Analyst in terms of SEBI (Research Analyst) Regulations, 2014 vide registration number
INH000000164. Angel or its associates has not been debarred/ suspended by SEBI or any other regulatory authority for accessing
/dealing in securities Market. Angel or its associates/analyst has not received any compensation / managed or co-managed public
offering of securities of the company covered by Analyst during the past twelve months.
This document is solely for the personal information of the recipient, and must not be singularly used as the basis of any investment
decision. Nothing in this document should be construed as investment or financial advice. Each recipient of this document should
make such investigations as they deem necessary to arrive at an independent evaluation of an investment in the securities of the
companies referred to in this document (including the merits and risks involved), and should consult their own advisors to determine
the merits and risks of such an investment.
Reports based on technical and derivative analysis center on studying charts of a stock's price movement, outstanding positions and
trading volume, as opposed to focusing on a company's fundamentals and, as such, may not match with a report on a company's
fundamentals. Investors are advised to refer the Fundamental and Technical Research Reports available on our website to evaluate the
contrary view, if any.
The information in this document has been printed on the basis of publicly available information, internal data and other reliable
sources believed to be true, but we do not represent that it is accurate or complete and it should not be relied on as such, as this
document is for general guidance only. Angel Broking Pvt. Limited or any of its affiliates/ group companies shall not be in any way
responsible for any loss or damage that may arise to any person from any inadvertent error in the information contained in this report.
Angel Broking Pvt. Limited has not independently verified all the information contained within this document. Accordingly, we cannot
testify, nor make any representation or warranty, express or implied, to the accuracy, contents or data contained within this document.
While Angel Broking Pvt. Limited endeavors to update on a reasonable basis the information discussed in this material, there may be
regulatory, compliance, or other reasons that prevent us from doing so.
This document is being supplied to you solely for your information, and its contents, information or data may not be reproduced,
redistributed or passed on, directly or indirectly.
Neither Angel Broking Pvt. Limited, nor its directors, employees or affiliates shall be liable for any loss or damage that may arise from
or in connection with the use of this information.
Disclosure of Interest Statement
L&T Finance Holdings Ltd
1. Financial interest of research analyst or Angel or his Associate or his relative
No
2. Ownership of 1% or more of the stock by research analyst or Angel or associates or relatives
No
3. Served as an officer, director or employee of the company covered under Research
No
4. Broking relationship with company covered under Research
No
Ratings (Based on expected returns
Buy (> 15%)
Accumulate (5% to 15%)
Neutral (-5 to 5%)
over 12 months investment period):
Reduce (-5% to -15%)
Sell (< -15)